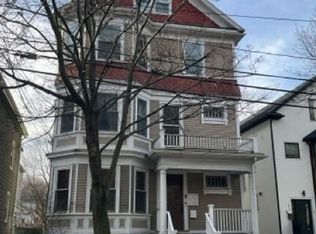
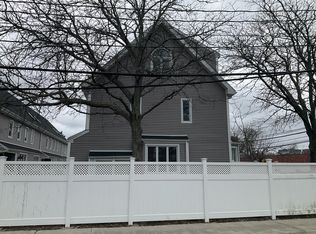
This existing single family home sits on a corner lot in a quiet neighborhood on the Cambridge/Belmont line. It offers the potential for a variety of residential development options under the updated Cambridge zoning code, though the best fit may be three (3) ~2,000 sq ft townhomes with off street parking. Similar developments are underway in the neighborhood and offer reliable comparisons for this project’s viability. The property is currently occupied and the tenants have plans to vacate this spring.
Pending
$1,280,000
23 Normandy Ter, Cambridge, MA 02138
4beds
969sqft
Single Family Residence
Built in 1902
3,542 Square Feet Lot
$1,006,500 Zestimate®
$1,321/sqft
$-- HOA
What's special
- 25 days |
- 4 |
- 0 |
Zillow last checked:
Listing updated:
Listed by:
Zachary Feldshuh 607-342-5872,
Choose Boston, LLC 617-388-9336
Source: MLS PIN,MLS#: 73523182
Facts & features
Interior
Bedrooms & bathrooms
- Bedrooms: 4
- Bathrooms: 2
- Full bathrooms: 2
Heating
- Baseboard
Cooling
- Window Unit(s)
Features
- Has basement: No
- Has fireplace: No
Interior area
- Total structure area: 969
- Total interior livable area: 969 sqft
- Finished area above ground: 969
Property
Lot
- Size: 3,542 Square Feet
- Features: Corner Lot
Details
- Parcel number: 419318
- Zoning: RES
Construction
Type & style
- Home type: SingleFamily
- Architectural style: Ranch
- Property subtype: Single Family Residence
Materials
- Foundation: Concrete Perimeter
Condition
- Year built: 1902
Utilities & green energy
- Sewer: Public Sewer
- Water: Public
Community & HOA
HOA
- Has HOA: No
Location
- Region: Cambridge
Financial & listing details
- Price per square foot: $1,321/sqft
- Tax assessed value: $920,100
- Annual tax amount: $5,712
- Date on market: 6/9/2026
Estimated market value
$1,006,500
$936,000 - $1.08M
$4,272/mo
Price history
| Date | Event | Price |
|---|---|---|
| 5/23/2026 | Pending sale | $1,280,000+161.8%$1,321/sqft |
Source: MLS PIN #73523182 Report a problem | ||
| 8/25/2023 | Listing removed | -- |
Source: Zillow Rentals Report a problem | ||
| 7/29/2023 | Listed for rent | $4,200+7.7%$4/sqft |
Source: Zillow Rentals Report a problem | ||
| 2/10/2023 | Listing removed | -- |
Source: Zillow Rentals Report a problem | ||
| 2/3/2023 | Price change | $3,900-7.1%$4/sqft |
Source: Zillow Rentals Report a problem | ||
| 1/17/2023 | Listed for rent | $4,200-6.7%$4/sqft |
Source: Zillow Rentals Report a problem | ||
| 1/10/2023 | Listing removed | -- |
Source: Zillow Rentals Report a problem | ||
| 12/24/2022 | Listed for rent | $4,500$5/sqft |
Source: Zillow Rentals Report a problem | ||
| 9/14/2011 | Listing removed | $489,000$505/sqft |
Source: All Star Realty, Inc. #71245400 Report a problem | ||
| 7/21/2011 | Price change | $489,000-2%$505/sqft |
Source: All Star Realty, Inc. #71245400 Report a problem | ||
| 6/9/2011 | Listed for sale | $499,000$515/sqft |
Source: All Star Realty, Inc. #71245400 Report a problem | ||
Public tax history
| Year | Property taxes | Tax assessment |
|---|---|---|
| 2025 | $5,712 +7% | $899,500 -0.3% |
| 2024 | $5,340 +6.1% | $902,100 +5% |
| 2023 | $5,033 +4% | $858,800 +5.1% |
| 2022 | $4,840 +7.4% | $817,500 +6.1% |
| 2021 | $4,508 +3.4% | $770,600 +1.7% |
| 2020 | $4,358 +7.1% | $757,900 +10.6% |
| 2019 | $4,069 +8.6% | $685,100 +15% |
| 2018 | $3,747 +2.9% | $595,700 +6.1% |
| 2017 | $3,643 +3% | $561,400 +10.9% |
| 2016 | $3,538 +0.8% | $506,200 +12.7% |
| 2015 | $3,511 +1.6% | $449,000 +8.9% |
| 2014 | $3,456 +1.1% | $412,400 +4.5% |
| 2013 | $3,418 -3.4% | $394,700 -5.4% |
| 2012 | $3,539 +5.3% | $417,300 +1.3% |
| 2011 | $3,361 +5.5% | $411,900 -0.2% |
| 2010 | $3,185 +2.1% | $412,600 |
| 2009 | $3,119 -0.9% | $412,600 -3.5% |
| 2008 | $3,147 +0.3% | $427,600 +1.9% |
| 2007 | $3,139 +3% | $419,700 +1.6% |
| 2006 | $3,049 -4% | $413,100 +1.2% |
| 2005 | $3,177 +0.7% | $408,300 -1.2% |
| 2004 | $3,154 +20.8% | $413,400 +15% |
| 2003 | $2,610 +5.6% | $359,500 +5% |
| 2002 | $2,472 -0.4% | $342,400 +32.9% |
| 2000 | $2,483 | $257,600 +15% |
| 1999 | -- | $224,000 |
Find assessor info on the county website
Monthly payment
Est. payment$--/mo
Payment breakdown
Explore the cost of this home by adjusting the details. Changes won't be saved.All calculations are estimates and provided by Zillow, Inc. for informational purposes only. Actual amounts may vary.
HOA fees may include property taxes on listings classified as Co-Ops. Contact the listing agent and/or owner for fee details.
Mortgage interest rates are dependent on a number of factors, including credit score, down payment, and repayment length. Interest rate data provided by Zillow Group Marketplace, Inc. as of 1/1/1970 from various mortgage lenders with which we have lead or other similar arrangements; the Estimated Payment is an average of those rates.
See how much you could borrow to make a competitive offer.
Climate risks
Neighborhood: Cambridge Highlands
Nearby schools
GreatSchools rating
- 7/10Haggerty SchoolGrades: PK-5Distance: 1.1 mi
- 8/10Rindge Avenue Upper SchoolGrades: 6-8Distance: 1.4 mi
- 8/10Cambridge Rindge and Latin SchoolGrades: 9-12Distance: 2.6 mi
A local agent can set up tours, give advice and negotiate with sellers.
A local lender can help you make sure your offer is ready when you are.


Nearby cities
Nearby neighborhoods
Nearby zip codes
Other Cambridge Topics
