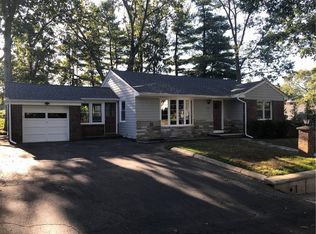
Welcome to this charming 3–4 bedroom Ranch located in a desirable neighborhood! This well-maintained home features beautiful hardwood floors, a spacious living room with a cozy fireplace, and a kitchen with granite countertops. Additional highlights include vinyl siding and windows, an architectural roof, and fresh interior paint throughout. Situated on an elevated corner lot, this property offers great curb appeal and plenty of potential. Conveniently located near shopping, schools, highways, and local amenities. A wonderful place to call home—come see all that this property has to offer! A MUST SEE!!
Active
Price cut: $10K (11/2)
$424,977
23 Shortway Dr, West Warwick, RI 02893
4beds
1,529sqft
Single Family Residence
Built in 1955
10,454 Square Feet Lot
$425,500 Zestimate®
$278/sqft
$-- HOA
What's special
Cozy fireplaceFresh interior paint throughoutVinyl sidingKitchen with granite countertopsBeautiful hardwood floorsElevated corner lotGreat curb appeal
- 49 days
- 570
- 45
Zillow last checked:
Listing updated:
Listed by:
David Tatangelo 401-465-0263,
RE/MAX Real Estate Center
Source: StateWide MLS RI,MLS#: 1423602
Facts & features
Interior
Bedrooms & bathrooms
- Bedrooms: 4
- Bathrooms: 2
- Full bathrooms: 1
- 1/2 bathrooms: 1
Heating
- Oil, Baseboard, Forced Water
Cooling
- Wall Unit(s)
Appliances
- Included: Dishwasher, Dryer, Refrigerator, Washer, Tankless Water Heater
Features
- Wall (Plaster), Stairs, Plumbing (Mixed), Insulation (Ceiling), Insulation (Unknown), Insulation (Walls), Ceiling Fan(s)
- Flooring: Ceramic Tile, Hardwood, Vinyl
- Windows: Insulated Windows
- Basement: Full,Interior and Exterior,Partially Finished,Family Room,Laundry,Storage Space,Utility
- Number of fireplaces: 1
- Fireplace features: Brick
Interior area
- Total structure area: 1,329
- Total interior livable area: 1,529 sqft
- Finished area above ground: 1,329
- Finished area below ground: 200
Property
Parking
- Total spaces: 2
- Parking features: Integral, Driveway
- Attached garage spaces: 1
- Has uncovered spaces: Yes
Features
- Patio & porch: Screened
Lot
- Size: 10,454 Square Feet
- Features: Corner Lot, Security, Wooded
Details
- Foundation area: 1040
- Parcel number: WWAR04203230000
- Other equipment: Cable TV
Construction
Type & style
- Home type: SingleFamily
- Architectural style: Ranch
- Property subtype: Single Family Residence
Materials
- Plaster, Vinyl Siding
- Foundation: Concrete Perimeter
Condition
- New construction: No
- Year built: 1955
Utilities & green energy
- Electric: 100 Amp Service
- Sewer: Public Sewer
- Water: Municipal
- Utilities for property: Sewer Connected, Water Connected
Community & HOA
Community
- Features: Near Public Transport, Commuter Bus, Golf, Highway Access, Hospital, Interstate, Recreational Facilities, Restaurants, Schools, Near Shopping
- Security: Security System Owned
- Subdivision: Brookside
HOA
- Has HOA: No
Location
- Region: West Warwick
Financial & listing details
- Price per square foot: $278/sqft
- Tax assessed value: $368,600
- Annual tax amount: $5,267
- Date on market: 9/21/2026
Estimated market value
$425,500
$404,000 - $447,000
$3,102/mo
Price history
| Date | Event | Price |
|---|---|---|
| 11/2/2026 | Price change | $424,977-2.3%$278/sqft |
Source:  StateWide MLS RI #1423602 Report a problem | ||
| 9/21/2026 | Listed for sale | $434,977+64.8%$284/sqft |
Source: StateWide MLS RI #1423602 Report a problem | ||
| 10/19/2024 | Listing removed | $2,600-10.3%$2/sqft |
Source: Zillow Rentals Report a problem | ||
| 10/10/2024 | Listed for rent | $2,900$2/sqft |
Source: Zillow Rentals Report a problem | ||
| 9/18/2020 | Sold | $264,000-1.3%$173/sqft |
Source: StateWide MLS RI #1258970 Report a problem | ||
| 9/18/2020 | Pending sale | $267,500$175/sqft |
Source: RE/MAX Advantage Group #1258970 Report a problem | ||
| 7/15/2020 | Listed for sale | $267,500+38.6%$175/sqft |
Source: RE/MAX ADVANTAGE GROUP #1258970 Report a problem | ||
| 12/17/2014 | Sold | $193,000-3.5%$126/sqft |
Source: Public Record Report a problem | ||
| 10/11/2014 | Price change | $199,900-2.5%$131/sqft |
Source: Real Estate Revolution LLC #1077830 Report a problem | ||
| 9/23/2014 | Price change | $205,000-4.7%$134/sqft |
Source: Real Estate Revolution LLC #1077830 Report a problem | ||
| 9/4/2014 | Listed for sale | $215,000+83.8%$141/sqft |
Source: Real Estate Revolution LLC #1077830 Report a problem | ||
| 7/7/2014 | Sold | $117,000-6.4%$77/sqft |
Source: Public Record Report a problem | ||
| 3/16/2014 | Price change | $125,000-7.4%$82/sqft |
Source: RE/MAX Advantage Group #1054800 Report a problem | ||
| 1/28/2014 | Price change | $135,000-6.9%$88/sqft |
Source: RE/MAX Advantage Group #1054800 Report a problem | ||
| 11/28/2013 | Price change | $145,000-6.5%$95/sqft |
Source: RE/MAX Advantage Group #1054800 Report a problem | ||
| 11/6/2013 | Listed for sale | $155,000$101/sqft |
Source: RE/MAX Advantage Group #1054800 Report a problem | ||
Public tax history
| Year | Property taxes | Tax assessment |
|---|---|---|
| 2025 | $5,267 +6.8% | $368,600 +39.7% |
| 2024 | $4,930 +2% | $263,800 |
| 2023 | $4,833 +1.6% | $263,800 |
| 2022 | $4,759 +3.2% | $263,800 +31.6% |
| 2021 | $4,612 | $200,500 |
| 2020 | $4,612 -21.6% | $200,500 |
| 2019 | $5,879 +31.3% | $200,500 +21.7% |
| 2018 | $4,477 +3.3% | $164,700 |
| 2017 | $4,333 +1.8% | $164,700 |
| 2016 | $4,256 +12.6% | $164,700 +13.1% |
| 2015 | $3,780 +309% | $145,600 |
| 2014 | $924 -74.3% | $145,600 |
| 2013 | $3,592 -10.7% | $145,600 -22.6% |
| 2011 | $4,023 | $188,000 |
| 2010 | $4,023 +1.3% | $188,000 -20.4% |
| 2009 | $3,973 +5.7% | $236,200 |
| 2008 | $3,760 +4.3% | $236,200 |
| 2007 | $3,604 +16% | $236,200 +34.9% |
| 2006 | $3,106 +86.1% | $175,100 |
| 2004 | $1,669 -44.6% | $175,100 +81.6% |
| 2003 | $3,012 | $96,400 |
Find assessor info on the county website
Monthly payment
Est. payment
Payment breakdown
Explore the cost of this home by adjusting the details. Changes won't be saved.Climate risks
Neighborhood: 02893
Similar homes
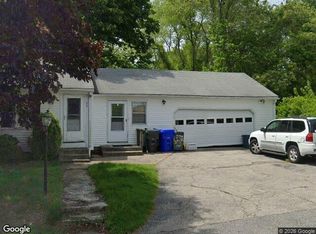
- $--3 bd1 ba1.9k sqft54 Melrose St, West Warwick, RI 02893Auction
 Xome
- $400,0002 bd2 ba1.3k sqft74 Curson St, West Warwick, RI 02893For Sale

 MLS ID #1428063, Lisa Halajko, Blu Sky Real Estate. StateWide MLS RI
- $399,9005 bd2 ba1.5k sqft786 Providence St, West Warwick, RI 02893For Sale
 MLS ID #1419671, Kyle Seyboth, Century 21 Limitless. StateWide MLS RI
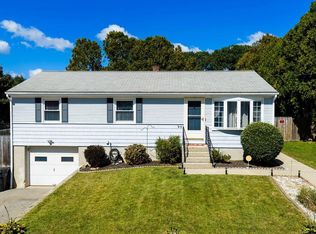
- $419,9003 bd1 ba2k sqft24 Vincenzo Dr, West Warwick, RI 02893For Sale
 MLS ID #1424349, Millie Pereira, Excel Companies. StateWide MLS RI
- $419,9004 bd2 ba2k sqft10 Gendron St, West Warwick, RI 02893For SaleMLS ID #1427013, Remi Lanoie, Yorway Realty. StateWide MLS RI
- $429,9003 bd2 ba1.5k sqft148 Wakefield St, West Warwick, RI 02893For SaleMLS ID #1424711, Nancy Pelaez, Real Broker, LLC. StateWide MLS RI
- $374,9002 bd2 ba992 sqft58 Earl St, West Warwick, RI 02893For SaleMLS ID #1427992, Renato De Lima, Innovations Realty. StateWide MLS RI
- $479,9003 bd2 ba1k sqft23 Aberdeen St, West Warwick, RI 02893For SaleMLS ID #1428025, Paula Gallant, REMAX Revolution. StateWide MLS RI
- $449,0004 bd2 ba2k sqft26 Central St, West Warwick, RI 02893For SaleMLS ID #1427931, Nicole Parente, SERHANT.. StateWide MLS RI
- $399,9993 bd2 ba2.2k sqft10 Park Blvd, West Warwick, RI 02893For SaleMLS ID #1427476, Christine Meschino, Start Realty. StateWide MLS RI
- $449,9003 bd2 ba2.1k sqft90 Locust Glen Dr, Cranston, RI 02921For SaleMLS ID #1427870, James Luth, HERE Realty. StateWide MLS RI
- $449,9903 bd1 ba1.1k sqft10 Amanda St, Cranston, RI 02920For SaleMLS ID #1428117, Kathy Jo Lake, RI Real Estate Services. StateWide MLS RI
- $449,9004 bd3 ba2.1k sqft50 Epworth Ave, West Warwick, RI 02893For SaleMLS ID #1426599, The Modern Collective Group, Compass. StateWide MLS RI
- $374,9003 bd2 ba1.2k sqft74 Aberdeen St, West Warwick, RI 02893For SaleMLS ID #1421869, Janet Audet, Coldwell Banker Realty. StateWide MLS RI
- $479,9003 bd3 ba1.7k sqft17 Brook St, West Warwick, RI 02893For SaleMLS ID #1427514, Michael Cabeceiras, RE/MAX ONE. StateWide MLS RI
- $375,0003 bd2 ba2.1k sqft26 Fornelli St, West Warwick, RI 02893For SaleMLS ID #1424669, Jesiane Fernandes, Real Broker, LLC. StateWide MLS RI
- $440,0004 bd2 ba1.5k sqft27-29 South St, West Warwick, RI 02893For SaleMLS ID #1424524, Kyle Seyboth, Century 21 Limitless. StateWide MLS RI
