Skip main navigation
Off market
Street View
  • $1,274,400

    230 NE 9th St, Delray Beach, FL 33444

    4beds
    2baths
    1,499sqft
    SingleFamily
    Built in 1953
    6,229 Square Feet Lot
    $1,274,400 Zestimate®
    $850/sqft
    $7,168 Estimated rent

    Home value

    $1,274,400

    $1.10M - $1.47M

    $7,168/mo

    Zestimate® history
    Loading
    Loading...

    Owner options

    List your home for rent

    $7,168/mo

    Rent Zestimate®

    Find your next renter with Zillow Rental Manager. Plus, with online applications, you can quickly screen prospective tenants – for free.

    Learn more

    $7,168/mo

    Rent Zestimate®

    Refinance and save

    $8,615/mo

    Est. payment

    Refinancing to a lower rate could help reduce your monthly payments and save thousands over the life of the loan.

    See today's rates

    $8,615/mo

    Est. payment

    Explore your selling options

    Work with a Zillow partner agent

    Leverage their expertise and Zillow's premium Showcase listings to get your home seen by more buyers.

    Get started

    List with your own agent

    Get your home in front of millions of buyers by listing it on Zillow.

    Learn how to do it

    Sell it yourself

    Take full control of how buyers see your home on Zillow by listing For Sale by Owner (FSBO).

    List your home

    What's special

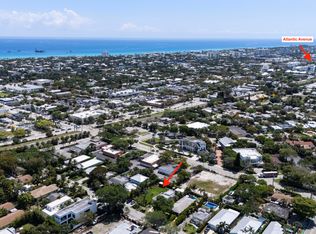
    This is a very clean home with great character. Located in a Quiet neighbor less than a mile from the beach and downtown Delray. Plenty of shops, restaurants and night life is just around the corner. Enjoy FREE door to door local transportation 7 days a week with the Downtowner. Large fenced in yard with Lawn Care included. Laundry on premise. Pets Welcome. Great neighbors. Pictures will be posted in the next few daysOwner pays for Lawn Care. First, last, and security required. Tenant is responsible for water and electric. Good standing credit. Pet deposit required. Pictures will be posted in the next few days.

    This property is off market, which means it's not currently listed for sale or rent on Zillow. This may be different from what's available on other websites or public sources.

    Facts & features

    Interior

    Bedrooms & bathrooms
    • Bedrooms: 4
    • Bathrooms: 2
    Heating
    • Forced air
    Cooling
    • Central, Other
    Appliances
    • Included: Dishwasher, Freezer, Garbage disposal, Range / Oven, Refrigerator, Washer
    Features
    • Flooring: Tile, Hardwood
    Interior area
    • Total interior livable area: 1,499 sqft

    Property

    Parking
    • Parking features: Off-street
    Features
    • Exterior features: Other
    Lot
    • Size: 6,229 sqft
    Details
    • Parcel number: 12434609280120090

    Construction

    Type & style
    • Home type: SingleFamily
    Materials
    • masonry
    • Roof: Other
    Condition
    • Year built: 1953

    Community & neighborhood

    Location
    • Region: Delray Beach

    Price history

    DateEventPrice
    9/21/2015Sold$244,000-0.2%$163/sqft
    Source: Public Record Report a problem
    5/7/2014Sold$244,500+8.7%$163/sqft
    Source: BeachesMLS #R9992573 Report a problem
    11/14/2013Price change$225,000-10%$150/sqft
    Source: ATLANTIC FLORIDA PROPERTIES #RX-9992573 Report a problem
    11/11/2013Listed for sale$249,999-10.4%$167/sqft
    Source: ATLANTIC FLORIDA PROPERTIES #RX-9992573 Report a problem
    1/8/2013Listing removed$279,000$186/sqft
    Source: Love USA Real Estate, Inc. #R3225403 Report a problem
    2/1/2012Listed for sale$279,000+13%$186/sqft
    Source: Love USA Real Estate, Inc. #R3225403 Report a problem
    1/8/2004Sold$247,000+474.4%$165/sqft
    Source: Public Record Report a problem
    1/21/1994Sold$43,000$29/sqft
    Source: Public Record Report a problem

    Public tax history

    YearProperty taxesTax assessment
    2025$6,359 +5.5%$367,470 +2.9%
    2024$6,027 -0.3%$357,114 +3%
    2023$6,043 +0.9%$346,713 +3%
    2022$5,990 -0.1%$336,615 +3%
    2021$5,996 +11.1%$326,811 +10.8%
    2020$5,399 +1.4%$295,080 +2.3%
    2019$5,324 $288,446 +1.9%
    2018$5,324 +4.5%$283,068 +61.9%
    2017$5,096 +71.5%$174,880 -28.2%
    2016$2,971 -44.8%$243,440 +19.4%
    2015$5,380 +14.6%$203,886 +56.5%
    2014$4,694 +115.8%$130,258 +1.5%
    2013$2,175 -0.1%$128,333 +1.7%
    2012$2,176 -17.3%$126,188 -12.3%
    2011$2,631 -4.8%$143,868 -3.6%
    2010$2,765 -20.5%$149,217 -19%
    2009$3,477 +10.9%$184,326 +0.1%
    2008$3,135 -4.2%$184,142 +3%
    2007$3,273 -5.8%$178,779 +2.5%
    2006$3,475 $174,419 +3%
    2005-- $169,339 +3%
    2004$2,073 +1212.1%$164,407 +41.4%
    2003$158 -94.4%$116,306 +6.1%
    2002$2,797 +10.2%$109,598 +12.1%
    2001$2,538 +39%$97,763 +41.1%
    2000$1,826 +21.1%$69,277 +9%
    1999$1,508 $63,558

    Find assessor info on the county website

    Neighborhood: Seacrest

    Nearby schools

    GreatSchools rating
    Get a cash offer in 3 minutes
    Find out how much your home could sell for in as little as 3 minutes with a no-obligation cash offer.
    Estimated market value
    $1,274,400
    Get a cash offer in 3 minutes
    Find out how much your home could sell for in as little as 3 minutes with a no-obligation cash offer.
    Estimated market value
    $1,274,400