3BD/1BA brick home in a cul-de-sac! Architectural shingle roof, pantry, laundry room with washer and dryer, and Cat 5 wiring throughout. Large fenced backyard with a storage shed. Conveniently located near the Seabee Base.
Active
$140,000
230 Tandy Dr, Gulfport, MS 39503
3beds
957sqft
Residential, Single Family Residence
Built in 1972
0.29 Acres Lot
$90,800 Zestimate®
$146/sqft
$-- HOA
What's special
Storage shedLarge fenced backyardArchitectural shingle roof
- 3 days
- 272
- 26
Likely to sell faster than
Zillow last checked:
Listing updated:
Listed by:
Taryn P Flynt 228-697-3862,
Stars and Stripes Realty, LLC. 228-219-7653,
Laura M Bryan 228-861-4438
Source: MLS United,MLS#: 4167203
Facts & features
Interior
Bedrooms & bathrooms
- Bedrooms: 3
- Bathrooms: 1
- Full bathrooms: 1
Heating
- Central
Cooling
- Central Air
Appliances
- Included: Stainless Steel Appliance(s)
Features
- Flooring: Tile
- Has fireplace: No
Interior area
- Total structure area: 957
- Total interior livable area: 957 sqft
Video & virtual tour
Property
Parking
- Parking features: Driveway, Concrete
- Has uncovered spaces: Yes
Features
- Levels: One
- Stories: 1
- Exterior features: Other
- Fencing: Back Yard
Lot
- Size: 0.29 Acres
- Features: Cul-De-Sac
Details
- Additional structures: Shed(s)
- Parcel number: 0808h03058.000
Construction
Type & style
- Home type: SingleFamily
- Property subtype: Residential, Single Family Residence
Materials
- Brick
- Foundation: Slab
- Roof: Architectural Shingles
Condition
- Move In Ready
- New construction: No
- Year built: 1972
Utilities & green energy
- Sewer: Public Sewer
- Water: Public
- Utilities for property: Electricity Connected, Sewer Connected, Water Connected
Community & HOA
Community
- Subdivision: Olivet
HOA
- Has HOA: No
Location
- Region: Gulfport
Financial & listing details
- Price per square foot: $146/sqft
- Tax assessed value: $46,378
- Annual tax amount: $829
- Date on market: 11/2/2026
- Electric utility on property: Yes
Estimated market value
$90,800
$69,000 - $114,000
$1,204/mo
Price history
| Date | Event | Price |
|---|---|---|
| 11/2/2026 | Listed for sale | $140,000$146/sqft |
Source: MLS United #4167203 Report a problem | ||
| 12/23/2024 | Listing removed | $1,200$1/sqft |
Source: Zillow Rentals Report a problem | ||
| 12/9/2024 | Listed for rent | $1,200$1/sqft |
Source: Zillow Rentals Report a problem | ||
| 11/6/2024 | Listing removed | $1,200$1/sqft |
Source: Zillow Rentals Report a problem | ||
| 10/22/2024 | Listed for rent | $1,200$1/sqft |
Source: Zillow Rentals Report a problem | ||
| 10/11/2024 | Listing removed | $1,200$1/sqft |
Source: Zillow Rentals Report a problem | ||
| 9/30/2024 | Listed for rent | $1,200+20%$1/sqft |
Source: Zillow Rentals Report a problem | ||
| 2/27/2021 | Listing removed | -- |
Source: Owner Report a problem | ||
| 4/2/2020 | Listing removed | $1,000$1/sqft |
Source: Owner Report a problem | ||
| 10/9/2019 | Listed for rent | $1,000$1/sqft |
Source: Owner Report a problem | ||
Public tax history
| Year | Property taxes | Tax assessment |
|---|---|---|
| 2025 | $829 +4.3% | $6,957 +4.1% |
| 2024 | $795 +0.1% | $6,682 +0.6% |
| 2023 | $794 -0.6% | $6,643 |
| 2022 | $799 -0.3% | $6,643 -85% |
| 2021 | $802 -1% | $44,287 +2.2% |
| 2020 | $810 -0.6% | $43,319 +566.7% |
| 2019 | $814 | $6,498 |
| 2018 | $814 -0.8% | $6,498 |
| 2017 | $821 | $6,498 -12.7% |
| 2015 | $821 -14.1% | $7,443 -17.8% |
| 2014 | $956 | $9,060 +21.4% |
| 2013 | -- | $7,460 |
Find assessor info on the county website
Monthly payment
Est. payment
Payment breakdown
Explore the cost of this home by adjusting the details. Changes won't be saved.Climate risks
Neighborhood: 39503

Similar homes
- $125,0003 bd1 ba1.2k sqft215 Lavelle Dr, Gulfport, MS 39503For Sale
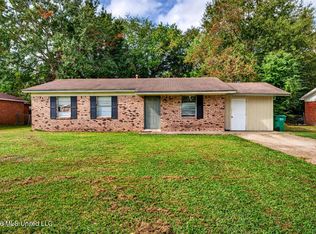 MLS ID #4167459, Michaela S Simms, Keller Williams. MLS United
- $156,5003 bd2 ba1k sqft402 Darby St, Gulfport, MS 39503For Sale
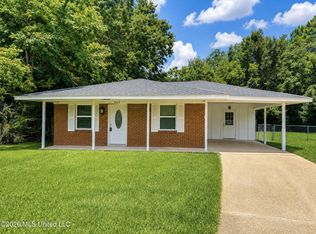 MLS ID #4167148, Kristin Smith, Rain Residential. MLS United
- $115,0003 bd1 ba1k sqft106 Olivet Dr, Gulfport, MS 39503For Sale
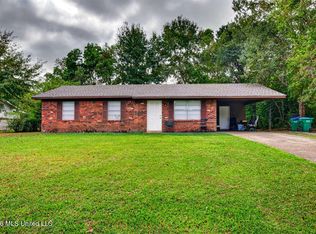 MLS ID #4167461, Michaela S Simms, Keller Williams. MLS United
- $150,0004 bd2 ba1.3k sqft22 Brittany Ct, Gulfport, MS 39503For Sale
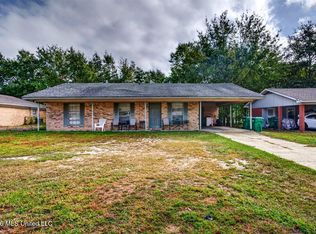 MLS ID #4167462, Michaela S Simms, Keller Williams. MLS United
