Welcome to this charming 2-bedroom, 1-bathroom home in the heart of West Louisville! This property offers modern vinyl plank flooring throughout which was installed in 2023. Two spacious bedrooms with ample closets. The eat-in kitchen offers plenty of room for everyday dining and has a large laundry closet. Great opportunity for an owner occupant or to add to your investment portfolio. This property can be sold with three other listings.
Pending
Price cut: $5K (10/8)
$74,000
2300 W Madison St, Louisville, KY 40211
2beds
880sqft
Single Family Residence
Built in 1900
3,920 Square Feet Lot
$-- Zestimate®
$84/sqft
$-- HOA
What's special
- 75 days
- 78
- 19
Zillow last checked:
Listing updated:
Listed by:
Katie L Lawson 502-562-0016,
Schempp Realty Company
Source: Metro Search Inc. LLC DBA Apex MLS,MLS#: 1728077
Facts & features
Interior
Bedrooms & bathrooms
- Bedrooms: 2
- Bathrooms: 1
- Full bathrooms: 1
Bedroom
- Level: First
Bedroom
- Level: First
Full bathroom
- Level: First
Kitchen
- Level: First
Laundry
- Level: First
Living room
- Level: First
Heating
- Forced Air
Cooling
- Central Air
Features
- Basement: None
- Has fireplace: No
Interior area
- Total structure area: 880
- Total interior livable area: 880 sqft
- Finished area above ground: 880
- Finished area below ground: 0
Property
Parking
- Parking features: On Street
- Has uncovered spaces: Yes
Features
- Stories: 1
Lot
- Size: 3,920 Square Feet
- Dimensions: 25 x 161
Details
- Parcel number: 02001C01370000
Construction
Type & style
- Home type: SingleFamily
- Architectural style: Traditional
- Property subtype: Single Family Residence
Materials
- Vinyl Siding
- Foundation: Crawl Space
- Roof: Shingle
Condition
- Year built: 1900
Utilities & green energy
- Sewer: Public Sewer
- Water: Public
- Utilities for property: Electricity Connected
Community & HOA
Community
- Subdivision: None
HOA
- Has HOA: No
Location
- Region: Louisville
Financial & listing details
- Price per square foot: $84/sqft
- Tax assessed value: $40,000
- Annual tax amount: $504
- Date on market: 9/3/2026
- Electric utility on property: Yes
Estimated market value
Not available
Estimated sales range
Not available
$956/mo
Price history
| Date | Event | Price |
|---|---|---|
| 11/9/2026 | Pending sale | $74,000$84/sqft |
Source:  Metro Search Inc. LLC DBA Apex MLS #1728077 Report a problem | ||
| 10/8/2026 | Price change | $74,000-6.3%$84/sqft |
Source: Metro Search Inc. LLC DBA Apex MLS #1728077 Report a problem | ||
| 9/17/2026 | Price change | $79,000-9.2%$90/sqft |
Source: Metro Search Inc. LLC DBA Apex MLS #1728077 Report a problem | ||
| 9/3/2026 | Price change | $87,000-3.3%$99/sqft |
Source: Metro Search Inc. LLC DBA Apex MLS #1728077 Report a problem | ||
| 8/5/2026 | Listed for sale | $90,000$102/sqft |
Source: Metro Search Inc. LLC DBA Apex MLS #1723917 Report a problem | ||
| 7/24/2026 | Contingent | $90,000$102/sqft |
Source: Metro Search Inc. LLC DBA Apex MLS #1723917 Report a problem | ||
| 7/21/2026 | Listed for sale | $90,000+125%$102/sqft |
Source: Metro Search Inc. LLC DBA Apex MLS #1723917 Report a problem | ||
| 7/16/2026 | Listing removed | $850$1/sqft |
Source: Zillow Rentals Report a problem | ||
| 3/30/2026 | Listed for rent | $850$1/sqft |
Source: Zillow Rentals Report a problem | ||
| 3/27/2025 | Listing removed | $850$1/sqft |
Source: Zillow Rentals Report a problem | ||
| 2/26/2025 | Price change | $850-5%$1/sqft |
Source: Zillow Rentals Report a problem | ||
| 10/22/2024 | Listed for rent | $895+12.6%$1/sqft |
Source: Zillow Rentals Report a problem | ||
| 7/3/2023 | Listing removed | -- |
Source: Zillow Rentals Report a problem | ||
| 6/12/2023 | Price change | $795-3.6%$1/sqft |
Source: Zillow Rentals Report a problem | ||
| 5/31/2023 | Price change | $825-8.2%$1/sqft |
Source: Zillow Rentals Report a problem | ||
| 5/12/2023 | Listed for rent | $899$1/sqft |
Source: Zillow Rentals Report a problem | ||
| 10/13/2022 | Sold | $40,000$45/sqft |
Source: Metro Search Inc. LLC DBA Apex MLS #1622419 Report a problem | ||
| 10/4/2022 | Pending sale | $40,000$45/sqft |
Source: Metro Search Inc. LLC DBA Apex MLS #1622419 Report a problem | ||
| 9/23/2022 | Contingent | $40,000$45/sqft |
Source: Metro Search Inc. LLC DBA Apex MLS #1622419 Report a problem | ||
| 9/19/2022 | Listed for sale | $40,000$45/sqft |
Source: Metro Search Inc. LLC DBA Apex MLS #1622419 Report a problem | ||
Public tax history
| Year | Property taxes | Tax assessment |
|---|---|---|
| 2025 | $504 -1.9% | $40,000 |
| 2024 | $514 -4.3% | $40,000 |
| 2023 | $537 +66.3% | $40,000 +68.5% |
| 2022 | $323 -6.2% | $23,740 |
| 2021 | $344 +5.5% | $23,740 |
| 2020 | $326 | $23,740 |
| 2019 | $326 -7.9% | $23,740 -11.3% |
| 2018 | $354 | $26,750 |
| 2017 | $354 +32.4% | $26,750 |
| 2013 | $268 +11.3% | $26,750 +11.3% |
| 2011 | $240 -11.1% | $24,040 -11.1% |
| 2010 | $271 | $27,050 |
| 2009 | $271 | $27,050 -24.1% |
| 2007 | -- | $35,640 |
| 2006 | -- | $35,640 |
| 2005 | -- | $35,640 +29.3% |
| 2004 | -- | $27,560 |
Find assessor info on the county website
Monthly payment
Est. payment
Payment breakdown
Explore the cost of this home by adjusting the details. Changes won't be saved.Climate risks
Neighborhood: Russell

Similar homes
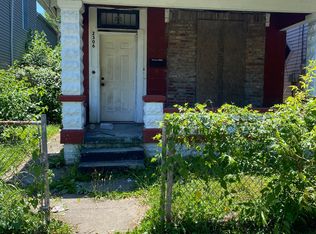
- $--2 bd1 ba1k sqft660 S 22nd St, Louisville, KY 40211Auction
 ServiceLink Auction
- $68,5002 bd1 ba1k sqft2703 Hale Ave, Louisville, KY 40211For Sale

 MLS ID #1729474, John A Koerner, Property Advancement Realty. Metro Search Inc. LLC DBA Apex MLS
- $70,0003 bd1 ba1.2k sqft1740 W Oak St, Louisville, KY 40210For Sale
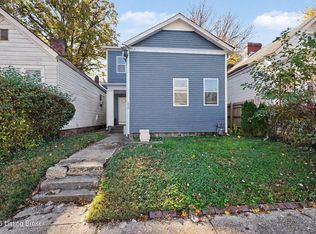 MLS ID #1734730, John Brace, Redfin. Metro Search Inc. LLC DBA Apex MLS
- $79,9002 bd1 ba1k sqft2631 W Kentucky St, Louisville, KY 40211For Sale
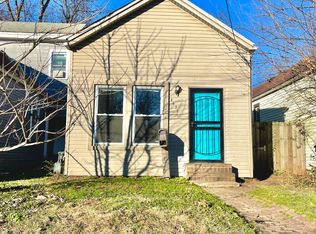 MLS ID #1730227, Corey Ritter, Mammoth Solutions, LLC. Metro Search Inc. LLC DBA Apex MLS
- $75,0003 bd1 ba816 sqft820 S 31st St, Louisville, KY 40211For SaleMLS ID #1724762, Tamika DeWalt, Noir Realty KY LLC. Metro Search Inc. LLC DBA Apex MLS
- $79,9002 bd1 ba720 sqft3419 Grand Ave, Louisville, KY 40211For SaleMLS ID #1727084, Tamika DeWalt, Noir Realty KY LLC. Metro Search Inc. LLC DBA Apex MLS
- $66,0002 bd1 ba832 sqft503 S 32nd St, Louisville, KY 40211For SaleMLS ID #1724573, Shey Blake, Winner Realty. Metro Search Inc. LLC DBA Apex MLS
- $79,9003 bd1 ba1k sqft3224 Kirby Ave, Louisville, KY 40211For SaleMLS ID #1731003, Kevin Peak, MINT Real Estate Group. Metro Search Inc. LLC DBA Apex MLS
- $69,9993 bd1 ba1.1k sqft3020 W Kentucky St, Louisville, KY 40211For SaleMLS ID #1720736, Jai'Rus Bibb, Re/Max Five Star Properties. Metro Search Inc. LLC DBA Apex MLS
- $81,9002 bd1 ba912 sqft2133 Columbia St, Louisville, KY 40212For SaleMLS ID #1729347, Heather Yates, Evans Property Management, LLC. Metro Search Inc. LLC DBA Apex MLS
- $70,0002 bd1 ba1.1k sqft214 N 34th St, Louisville, KY 40212For SaleMLS ID #1732149, Donald L Thomas, Eternal, LLC. Metro Search Inc. LLC DBA Apex MLS
- $69,0002 bd1 ba758 sqft226 N 26th St, Louisville, KY 40212For SaleMLS ID #1723560, LaShanda D Barber, G. Starks Realty Co.. Metro Search Inc. LLC DBA Apex MLS
- $74,9002 bd1 ba700 sqft1938 S 28th St, Louisville, KY 40210For SaleMLS ID #1732362, Eric Hibbs, Real Estate Pros of Kentucky. Metro Search Inc. LLC DBA Apex MLS
- $70,0002 bd1 ba975 sqft1847 Bank St, Louisville, KY 40203For SaleMLS ID #1721987, Daniel Wolf, Semonin Realtors. Metro Search Inc. LLC DBA Apex MLS
- $54,9952 bd1 ba688 sqft531 S 32nd St, Louisville, KY 40211For SaleMLS ID #1730107, Derrick Stewart, DREAM J P Pirtle REALTORS. Metro Search Inc. LLC DBA Apex MLS
- $50,0003 bd1 ba1k sqft514 S 28th St, Louisville, KY 40211For SaleMLS ID #1732969, Joshua S Lindley, TCB Property Management. Metro Search Inc. LLC DBA Apex MLS
- $75,0003 bd1 ba1k sqft313 N 27th St, Louisville, KY 40212For SaleMLS ID #1721425, Luke Castleman, BERKSHIRE HATHAWAY HomeServices, Parks & Weisberg Realtors. Metro Search Inc. LLC DBA Apex MLS
- $50,0002 bd1 ba905 sqft666 S 24th St, Louisville, KY 40211For SaleMLS ID #1723204, Derrick L Duncan, G. Starks Realty Co.. Metro Search Inc. LLC DBA Apex MLS
- $65,0002 bd2 ba685 sqft2904/2906 Saint Xavier St, Louisville, KY 40212For SaleMLS ID #1731976, Janet Dischinger, BERKSHIRE HATHAWAY HomeServices, Parks & Weisberg Realtors. Metro Search Inc. LLC DBA Apex MLS
- $82,5002 bd2 ba950 sqft1843 Lytle St, Louisville, KY 40203For SaleMLS ID #1729400, Heather Yates, Evans Property Management, LLC. Metro Search Inc. LLC DBA Apex MLS
