Investor opportunity in sought-after Randle Heights! Now priced at just $79,900, this detached property offers tremendous potential for a full renovation, investment project, or possible redevelopment. Situated on a 3,195 sq ft lot, the property provides an excellent opportunity for investors looking to add value in an established DC neighborhood. Conveniently located near Suitland Parkway, major commuter routes, shopping, and everyday amenities. Bring your vision and transform this property into its full potential. Sold strictly AS-IS. Don't miss this opportunity at an attractive price point!
Foreclosure
Price cut: $20K (7/29)
$79,900
2309 Irving St SE, Washington, DC 20020
--beds
--baths
3,195Square Feet
Unimproved Land
Built in ----
3,195 Square Feet Lot
$-- Zestimate®
$--/sqft
$-- HOA
What's special
- 195 days
- 120
- 5
Zillow last checked:
Listing updated:
Listed by:
Pennye Green 202-247-5668,
Long & Foster Real Estate, Inc.,
Listing Team: The Pennye Green Team, Co-Listing Team: The Pennye Green Team,Co-Listing Agent: Nadia Aminov 571-331-9745,
Long & Foster Real Estate, Inc.
Source: Bright MLS,MLS#: DCDC2255354
Facts & features
Property
Lot
- Size: 3,195 Square Feet
- Features: Unknown Soil Type
Details
- Parcel number: 5846//0010
- Zoning: R-2
- Special conditions: Real Estate Owned
Utilities & green energy
- Sewer: Public Sewer
- Water: Public
Community & HOA
Community
- Subdivision: Randle Heights
HOA
- Has HOA: No
Location
- Region: Washington
Financial & listing details
- Tax assessed value: $205,220
- Annual tax amount: $5,858
- Date on market: 4/10/2026
- Listing agreement: Exclusive Right To Sell
- Ownership: Fee Simple
Foreclosure details
Estimated market value
Not available
Estimated sales range
Not available
$1,806/mo
Price history
| Date | Event | Price |
|---|---|---|
| 7/29/2026 | Price change | $79,900-20% |
Source:  Long & Foster Broker Feed #DCDC2255352 Report a problem | ||
| 4/10/2026 | Listed for sale | $99,900-22.6% |
Source: Long & Foster Broker Feed #DCDC2255352 Report a problem | ||
| 4/9/2026 | Listing removed | $129,000 |
Source:  Bright MLS #DCDC2239536 Report a problem | ||
| 1/30/2026 | Price change | $129,000-7.2% |
Source: Bright MLS #DCDC2239536 Report a problem | ||
| 1/3/2026 | Listed for sale | $139,000 |
Source: Bright MLS #DCDC2239536 Report a problem | ||
| 1/1/2026 | Listing removed | $139,000 |
Source: Bright MLS #DCDC2209600 Report a problem | ||
| 12/12/2025 | Price change | $139,000-2.1% |
Source: Bright MLS #DCDC2209600 Report a problem | ||
| 12/1/2025 | Price change | $142,000-10.7% |
Source: Bright MLS #DCDC2209600 Report a problem | ||
| 11/3/2025 | Price change | $159,000-3.3% |
Source: Bright MLS #DCDC2209600 Report a problem | ||
| 10/20/2025 | Price change | $164,420-3% |
Source: Bright MLS #DCDC2209600 Report a problem | ||
| 9/2/2025 | Price change | $169,420-5.4% |
Source: Bright MLS #DCDC2209600 Report a problem | ||
| 8/12/2025 | Price change | $179,000-5.3% |
Source: Bright MLS #DCDC2209600 Report a problem | ||
| 7/29/2025 | Listed for sale | $189,000+2000% |
Source: Bright MLS #DCDC2209600 Report a problem | ||
| 3/9/1998 | Sold | $9,000 |
Source: Public Record Report a problem | ||
Public tax history
| Year | Property taxes | Tax assessment |
|---|---|---|
| 2026 | $1,744 -82.6% | $205,220 +2.5% |
| 2025 | $10,014 -48.8% | $200,280 +2.5% |
| 2024 | $19,547 +4.1% | $195,470 +4.1% |
| 2023 | $18,780 +111.8% | $187,800 +5.9% |
| 2022 | $8,868 +498.9% | $177,360 +1.8% |
| 2021 | $1,481 -91% | $174,210 +6.3% |
| 2020 | $16,390 +13.9% | $163,900 +13.9% |
| 2018 | $14,386 +37.3% | $143,860 +3% |
| 2017 | $10,480 +2.8% | $139,730 +2.8% |
| 2016 | $10,197 -21.5% | $135,960 +4.6% |
| 2015 | $12,994 +40.1% | $129,940 +5.1% |
| 2014 | $9,272 +35.6% | $123,630 -9.6% |
| 2013 | $6,837 +63.3% | $136,730 -4.4% |
| 2012 | $4,185 +244.1% | $143,090 |
| 2011 | $1,216 -87.6% | $143,090 -20.7% |
| 2010 | $9,790 -49.5% | $180,460 -7% |
| 2009 | $19,399 +1464.5% | $193,990 +37.7% |
| 2007 | $1,240 +35.9% | $140,900 +42.1% |
| 2006 | $912 +21.8% | $99,170 +27.1% |
| 2005 | $749 +16.2% | $78,010 +16.2% |
| 2004 | $645 +47.4% | $67,160 +47.4% |
| 2003 | $437 0% | $45,560 0% |
| 2002 | $437 -6.5% | $45,562 +12% |
| 2001 | $468 | $40,680 |
Find assessor info on the county website
Monthly payment
Climate risks
Neighborhood: Knox Hill
Nearby schools
Schools provided by the listing agent
- District: District Of Columbia Public Schools
Source: Bright MLS. This data may not be complete. We recommend contacting the local school district to confirm school assignments for this home.

Similar homes
- $95,0002,388 sqft3105 22nd St SE, Washington, DC 20020Lot/Land

 MLS ID #DCDC2176244, Ali Velasco, RLAH @properties. Bright MLS
- $95,0003,798 sqft2031 Jasper St SE, Washington, DC 20020Lot/Land
 MLS ID #DCDC2176234, Ali Velasco, RLAH @properties. Bright MLS
- $94,9903,150 sqft1700 T St SE, Washington, DC 20020Lot/Land
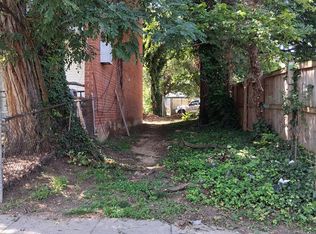 MLS ID #DCDC2170084, Nicole Marshall, Bennett Realty Solutions. Bright MLS
- $49,6771,474 sqftGainesville St SE, Washington, DC 20020Lot/Land
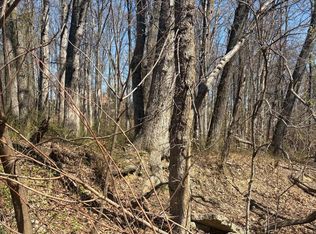 MLS ID #DCDC2252412, Tanya Cunningham, KW Metro Center. Bright MLS
- $51,9522,016 sqft15th St SE, Washington, DC 20020Lot/LandMLS ID #DCDC2196396, John Williams, Fairfax Realty Premier. Bright MLS
- $75,0002,500 sqft213 Valley Ave SE, Washington, DC 20032Lot/LandMLS ID #DCDC2284264, John Williams, Fairfax Realty Premier. Bright MLS
- $65,0002,225 sqftM St SE, Washington, DC 20019Lot/LandMLS ID #DCDC2255862, John Williams, Fairfax Realty Premier. Bright MLS
- $75,0003,062 sqft5220 Banks Pl NE, Washington, DC 20019Lot/LandMLS ID #DCDC2251696, Shaunte Parker, Compass. Bright MLS
- $60,0002,000 sqft329 56th St NE, Washington, DC 20019Lot/LandMLS ID #DCDC2276330, Jenn Smira, Compass. Bright MLS
- $85,0003.15 acresBock Rd, Fort Washington, MD 20744Lot/LandMLS ID #MDPG2210066, Tanavia Greer, Long & Foster Real Estate, Inc.. Bright MLS
- $85,0002,244 sqftVacant Lot 28, Washington, DC 20018Lot/LandMLS ID #DCDC2225532, Darius Richardson, Samson Properties. Bright MLS
- $100,0002,438 sqft1032 44th St NE, Washington, DC 20019Lot/LandMLS ID #DCDC2286296, Endeg Abebe, Long & Foster Real Estate, Inc.. Bright MLS
- $69,0004,349 sqft614 Capitol Heights Blvd, Capitol Heights, MD 20743Lot/LandMLS ID #MDPG2211828, Stefany Ramirez, RLAH @properties. Bright MLS
- $85,0001,583 sqftVacant Lot 804, Washington, DC 20018Lot/LandMLS ID #DCDC2222260, Darius Richardson, Samson Properties. Bright MLS
- $115,0004,400 sqft4647 G St SE, Washington, DC 20019Lot/LandMLS ID #DCDC2276334, Jenn Smira, Compass. Bright MLS
- $60,0002,672 sqftVacant Central Ave NE Lot 815, Washington, DC 20018Lot/LandMLS ID #DCDC2243544, Darius Richardson, Samson Properties. Bright MLS
- $85,0002,306 sqftVacant Lot 27, Washington, DC 20018Lot/LandMLS ID #DCDC2225522, Darius Richardson, Samson Properties. Bright MLS
- $90,0004,800 sqft4619 Addison Rd, Capitol Heights, MD 20743Lot/LandMLS ID #MDPG2218850, Shane Butler, Engel & Volkers Washington, DC. Bright MLS
- $65,0003,202 sqftVacant Central Ave NE Lot 813, Washington, DC 20018Lot/LandMLS ID #DCDC2243540, Darius Richardson, Samson Properties. Bright MLS
- $100,0001,780 sqftVacant Levis St NE Lot 811, Washington, DC 20002Lot/LandMLS ID #DCDC2243538, Darius Richardson, Samson Properties. Bright MLS
