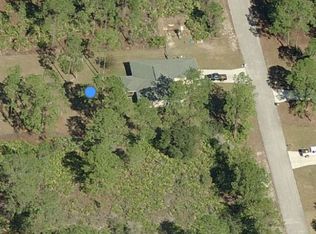
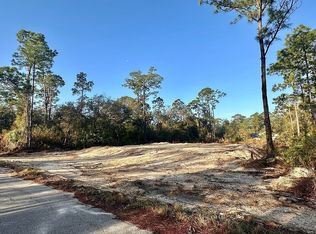
New Update as of July 17th ! Half acre just cleared cleared trees will be removed next week. See this perfect, cleared lot for yourself. Country living but near town! Are you looking for privacy, a large parcel of land, room to grow or to grow your own food? Look no further this property faces East so your backyard has lots of sun from 11:00 AM on until the sun goes down. 104 x 209 sized lot measures in at .50 of an acre. Minutes to schools in the area as well as minutes to shopping, groceries, pharmacies, restaurants and parks. You don't see many lots anymore priced below $50,000 and with more and more people coming to Florida...well the prices are sure to increase and the availability...not so much. Stake your claim on a piece of the Florida pie only so many slices to go around
Lot/land
Price increase: $15.6K (10/22)
$55,000
2309 Johns Avenue, Alva, FL 33920
--beds
--baths
0.5Acres
Unimproved Land
Built in ----
0.5 Acres Lot
$-- Zestimate®
$--/sqft
$-- HOA
What's special
Half acre just clearedPerfect cleared lot
- 902 days
- 13
- 0
Zillow last checked:
Listing updated:
Listed by:
Deborah R Stickney 772-521-0384,
Coldwell Banker/ Res. Real Est
Source: BeachesMLS,MLS#: R10889872 Originating MLS: BeachesMLS
Facts & features
Interior
Video & virtual tour
Property
Lot
- Size: 0.5 Acres
- Dimensions: 104 x 209.50 x 104.20 x 209.0
- Features: Cleared, Subdivision
- Residential vegetation: Mixed, Other, Partially Wooded
Details
- Parcel number: 01442712000480170
- Zoning: RS-1
Utilities & green energy
- Utilities for property: Cable Available, Electricity Available, None, Phone Available
Community & HOA
Community
- Subdivision: LEHIGH ACRES Unit 12, Block 48, Lot 17
HOA
- Has HOA: No
- Amenities included: None
Location
- Region: Alva
Financial & listing details
- Tax assessed value: $20,995
- Annual tax amount: $351
- Date on market: 5/17/2024
- Cumulative days on market: 1270 days
- Listing terms: Cash,Conventional,FHA,VA Loan
- Electric utility on property: Yes
- Road surface type: Paved
Estimated market value
Not available
Estimated sales range
Not available
Not available
Price history
| Date | Event | Price |
|---|---|---|
| 10/22/2026 | Price change | $55,000+39.6% |
Source:  BeachesMLS #R10889872 Report a problem | ||
| 5/23/2026 | Listed for sale | $39,400-2.5% |
Source: BeachesMLS #R10889872 Report a problem | ||
| 11/18/2025 | Price change | $40,400+2.5% |
Source: BeachesMLS #RX-10889872 Report a problem | ||
| 8/21/2025 | Listed for sale | $39,400-3.7% |
Source: BeachesMLS #RX-10889872 Report a problem | ||
| 2/11/2025 | Price change | $40,900-2.4% |
Source: BeachesMLS #RX-10889872 Report a problem | ||
| 12/19/2024 | Price change | $41,900-4.6% |
Source: BeachesMLS #RX-10889872 Report a problem | ||
| 7/29/2024 | Price change | $43,900+11.1% |
Source: BeachesMLS #RX-10889872 Report a problem | ||
| 7/18/2024 | Price change | $39,500+49.1% |
Source: BeachesMLS #RX-10889872 Report a problem | ||
| 5/17/2024 | Listed for sale | $26,500-10.2% |
Source: BeachesMLS #RX-10889872 Report a problem | ||
| 9/15/2023 | Price change | $29,500-11.9% |
Source: BeachesMLS #RX-10889872 Report a problem | ||
| 5/15/2023 | Listed for sale | $33,500+86.1% |
Source: BeachesMLS #RX-10889872 Report a problem | ||
| 4/13/2023 | Sold | $18,000-7.7% |
Source:  Florida Gulf Coast MLS #223014630 Report a problem | ||
| 3/22/2023 | Pending sale | $19,500 |
Source:  Florida Gulf Coast MLS #223014630 Report a problem | ||
| 2/23/2023 | Listed for sale | $19,500 |
Source: Florida Gulf Coast MLS #223014630 Report a problem | ||
Public tax history
| Year | Property taxes | Tax assessment |
|---|---|---|
| 2025 | $537 +9.5% | $18,290 +10% |
| 2024 | $490 +24.2% | $16,627 +76.2% |
| 2023 | $395 +12.3% | $9,437 +10% |
| 2022 | $352 +13.3% | $8,579 +53.2% |
| 2021 | $310 +1.4% | $5,600 +9.8% |
| 2020 | $306 +92.3% | $5,100 +6.3% |
| 2019 | $159 | $4,800 +6.7% |
| 2018 | $159 +9.8% | $4,500 -0.5% |
| 2017 | $145 +0.9% | $4,522 +2.8% |
| 2016 | $144 +6.5% | $4,400 +27.7% |
| 2015 | $135 +11.8% | $3,445 +8% |
| 2014 | $121 +14% | $3,190 +13.9% |
| 2013 | $106 +11.8% | $2,800 +14.3% |
| 2012 | $95 -16.7% | $2,450 -30% |
| 2011 | $114 -0.9% | $3,500 |
| 2010 | $115 -16.5% | $3,500 -30% |
| 2009 | $137 -48.6% | $5,000 -64.3% |
| 2008 | $267 -43.3% | $14,000 -47.6% |
| 2007 | $471 -40.7% | $26,700 -42.2% |
| 2006 | $794 +449.7% | $46,200 +740% |
| 2004 | $144 +86.2% | $5,500 +175% |
| 2003 | $78 +9.7% | $2,000 +25% |
| 2002 | $71 | $1,600 |
| 2000 | -- | $1,600 |
Find assessor info on the county website
Monthly payment
Climate risks
Neighborhood: 33920
Similar homes
- $49,9000.51 acres2015 Grant Ave, Alva, FL 33920For Sale By Owner
- $34,9000.5 acresN/A, Alva, FL 33920Lot/Land

 MLS ID #A12004386, Isora Ferrer, Realty One Group Evolution. MIAMI
- $35,5000.5 acres2117 Moore Ave, Alva, FL 33920Lot/Land

 MLS ID #2026003711, Dailyn Madrigal, Myland Realty Inc. Florida Gulf Coast MLS
- $29,5000.5 acres2004 Canton Ave, Alva, FL 33920Lot/Land
 MLS ID #224088350, Samir Naim, Naim Real Estate LLC. Florida Gulf Coast MLS
- $34,0000.5 acres2017 Columbus Ave, Alva, FL 33920Lot/LandMLS ID #2025025252, Sean Tanner, Sellstate 5 Star Realty. Florida Gulf Coast MLS
- $30,0000.28 acres4219 E 30TH STREET LOT 19, ALVA, FL 33920Lot/Land
 MLS ID #A4563640, Marilyn Sakelaris, LESLIE WELLS REALTY, INC.. Stellar MLS
- $49,9000.5 acres502 Truman AVE, LEHIGH ACRES, FL 33972Lot/Land
 MLS ID #225017918, Steven Koleno, Beycome of Florida LLC. SWFLMLS
- $30,0000.5 acres1708 Leroy Ave, Lehigh Acres, FL 33972Lot/LandMLS ID #2026031814, Eleene Ismail, Pelican Vista Realty. Florida Gulf Coast MLS
- $29,7500.5 acres1712 MCARTHUR AVENUE LOT 6, LEHIGH ACRES, FL 33972Lot/LandMLS ID #K4903861, Daniel Castaneda, AMERICAN REALTY OF PSL LLC. Stellar MLS
- $45,0000.5 acres1200 Scott Ave, Lehigh Acres, FL 33972Lot/LandMLS ID #2026008564, Heidi Benitez Zuniga, LPT Realty, LLC. Florida Gulf Coast MLS
- $50,0000.5 acres1504 Maple AVE N, LEHIGH ACRES, FL 33972Lot/LandMLS ID #226014686, Marjole Abreu, Key & Legacy Realty LLC. SWFLMLS
- $31,9000.5 acres1122 Johns Ave, Lehigh Acres, FL 33972Lot/LandMLS ID #2026025598, Heydi Hernandez Varela, Porter Davis Real Estate. Florida Gulf Coast MLS
- $45,9000.5 acres1407 THOMPSON AVENUE LOT 16, LEHIGH ACRES, FL 33972Lot/LandMLS ID #S5138372, Eugenia Hernandez, PREMIUM PROPERTIES R.E SERVICE. Stellar MLS
- $60,0000.27 acres410 E 12th St, Lehigh Acres, FL 33972Lot/LandMLS ID #2026035648, Angel Ruano, Century 21 Sunbelt Realty. Florida Gulf Coast MLS
- $35,5000.5 acres1610 DESOTO AVENUE LOT 7, LEHIGH ACRES, FL 33972Lot/LandMLS ID #K4903840, Adriana Gutierrez, AMERICAN REALTY OF PSL LLC. Stellar MLS
- $30,0000.5 acres1007 LEROY AVENUE LOT 16, LEHIGH ACRES, FL 33972Lot/LandMLS ID #G5081569, Darryl Love, WATSON REALTY CORP., REALTORS. Stellar MLS
- $35,5000.5 acres1014 Jackson Ave, Lehigh Acres, FL 33972Lot/LandMLS ID #225045495, Chris Durando, Sweetwater Land Company LLC. Florida Gulf Coast MLS
- $65,00010,018 sqftBuckingham Park., Fort Myers, FL 33905Lot/LandMLS ID #A12118174, Makeda Small, Grand Realty of America, Corp.. MIAMI
- $55,0000.25 acres3110 33rd ST W, LEHIGH ACRES, FL 33971Lot/LandMLS ID #225022091, Steven Koleno, Beycome of Florida LLC. SWFLMLS
