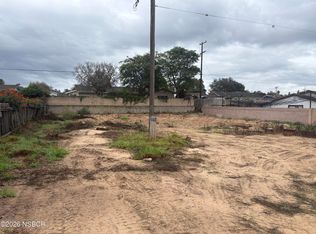
Two lots combined with plans already drawn for an impressive mixed-use building, with much of the groundwork already done and ready for your vision. Looking to build soon? This is your opportunity.The property sits along Lompoc's main corridor on scenic Highway 1, offering great visibility and convenience. There's also potential to separate the parcel back into two lots and develop multiple units. Buyers are encouraged to confirm all options with City Planning.Priced to move quickly at under $150k per lot, this is a rare below-market opportunity you don't want to miss.
Lot/land
$299,000
233 N H St, Lompoc, CA 93436
--beds
--baths
0.32Acres
Mixed Use
Built in ----
0.32 Acres Lot
$-- Zestimate®
$--/sqft
$-- HOA
What's special
Two lots combined
- 95 days
- 140
- 4
Zillow last checked:
Listing updated:
Listed by:
Todd Ranney DRE#: 01277637 805-588-2327,
LPT REALTY, INC
Source: North Santa Barbara County MLS,MLS#: 26001544
Estimated market value
Not available
Estimated sales range
Not available
Not available
Price history
| Date | Event | Price |
|---|---|---|
| 7/30/2026 | Listed for sale | $299,000-8% |
Source:  North Santa Barbara County MLS #26001544 Report a problem | ||
| 3/23/2026 | Listing removed | $325,000 |
Source: North Santa Barbara County MLS #25002136 Report a problem | ||
| 10/28/2025 | Listed for sale | $325,000-56.6% |
Source: North Santa Barbara County MLS #25002136 Report a problem | ||
| 9/21/2023 | Listing removed | -- |
Source: North Santa Barbara County MLS #23001377 Report a problem | ||
| 8/14/2023 | Listed for sale | $749,000+86.1% |
Source: North Santa Barbara County MLS #23001377 Report a problem | ||
| 9/6/2019 | Sold | $402,500 |
Source: Public Record Report a problem | ||
Public tax history
| Year | Property taxes | Tax assessment |
|---|---|---|
| 2026 | -- | $399,775 +2% |
| 2025 | $4,479 +5.7% | $391,937 +2% |
| 2024 | $4,236 +0.4% | $384,252 +2% |
| 2023 | $4,219 +1.3% | $376,734 +2% |
| 2022 | $4,166 -0.7% | $369,363 +23.8% |
| 2021 | $4,193 +122.8% | $298,287 +85% |
| 2020 | $1,882 -28.6% | $161,200 -27.7% |
| 2019 | $2,636 +36% | $223,000 +37.3% |
| 2018 | $1,938 +1.9% | $162,460 +2% |
| 2017 | $1,903 +1.8% | $159,275 +2% |
| 2016 | $1,869 +2.2% | $156,153 +1.5% |
| 2015 | $1,829 | $153,808 +2% |
| 2014 | $1,829 | $150,796 +2.5% |
| 2012 | -- | $147,173 +2% |
| 2011 | -- | $144,288 +0.8% |
| 2010 | -- | $143,211 -0.2% |
| 2009 | -- | $143,552 +2% |
| 2008 | -- | $140,738 +2% |
| 2007 | -- | $137,979 +2% |
| 2006 | -- | $135,275 +2% |
| 2005 | -- | $132,623 +3.9% |
| 2003 | -- | $127,641 +2% |
| 2002 | -- | $125,139 +2% |
| 2001 | -- | $122,686 +2% |
| 2000 | -- | $120,281 |
Find assessor info on the county website
Monthly payment
Climate risks
Neighborhood: 93436

Similar homes
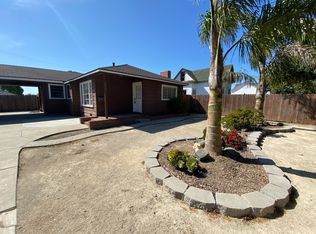
- $295,00040.25 acres1 Sweeney Rd, Lompoc, CA 93436Lot/Land
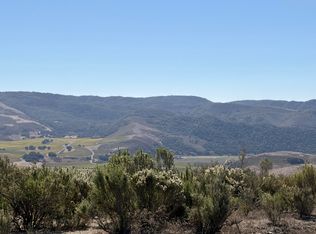 MLS ID #26-3632, Susan Jordano. SBMLS
- $170,0000.26 acres209 S 7th St, Lompoc, CA 93436Lot/Land
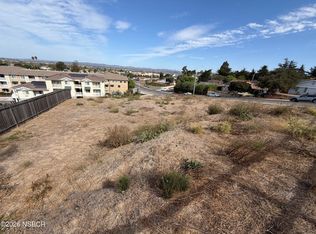 MLS ID #26002127, Rich Condit. North Santa Barbara County MLS
- $299,0000 sqft0 Oak Hill Dr, Lompoc, CA 93436Lot/Land
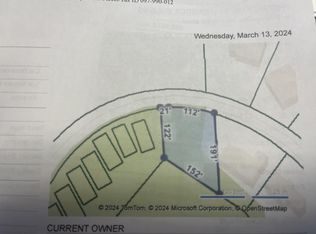 MLS ID #24-783, Debbie Murphy. SBMLS
- $399,9990.27 acresSiler Ln, Santa Maria, CA 93455Lot/Land
 MLS ID #26002203, Maria Guadalupe Guerrero. North Santa Barbara County MLS
Local buyer's agents are ready to help
