Nicely remodeled home, in quiet part of city, lots of updates, partial basement for storage needs. Large kitchen, separate dining room. Main floor laundry located in the bathroom. Buyer to verify all information.
Active
Price cut: $10K (10/2)
$89,900
2333 Leahy St, Muskegon Heights, MI 49444
2beds
972sqft
Single Family Residence
Built in 1920
6,098 Square Feet Lot
$-- Zestimate®
$92/sqft
$-- HOA
What's special
Remodeled homeMain floor laundrySeparate dining roomLarge kitchen
- 104 days
- 136
- 19
Zillow last checked:
Listing updated:
Listed by:
Kendra Marshall 616-298-6219,
Westshore Realty Group 231-798-6430
Source: MichRIC,MLS#: 26041072
Facts & features
Interior
Bedrooms & bathrooms
- Bedrooms: 2
- Bathrooms: 1
- Full bathrooms: 1
- Main level bedrooms: 2
Heating
- Forced Air
Appliances
- Included: Range
- Laundry: In Bathroom, Main Level
Features
- Flooring: Carpet, Laminate, Wood
- Basement: Partial
- Has fireplace: No
Interior area
- Total structure area: 972
- Total interior livable area: 972 sqft
- Finished area below ground: 0
Video & virtual tour
Property
Features
- Stories: 1
Lot
- Size: 6,098 Square Feet
- Dimensions: 50 x 125
- Features: Sidewalk
Details
- Parcel number: 26185097000900
Construction
Type & style
- Home type: SingleFamily
- Property subtype: Single Family Residence
Materials
- Vinyl Siding
- Roof: Composition
Condition
- New construction: No
- Year built: 1920
Utilities & green energy
- Sewer: Public Sewer
- Water: Public
- Utilities for property: Electricity Available, Natural Gas Connected
Community & HOA
Location
- Region: Muskegon Heights
Financial & listing details
- Price per square foot: $92/sqft
- Tax assessed value: $11,328
- Annual tax amount: $680
- Date on market: 8/6/2026
- Listing terms: Cash,FHA,VA Loan,MSHDA,Conventional
- Electric utility on property: Yes
- Road surface type: Paved
Estimated market value
Not available
Estimated sales range
Not available
$1,253/mo
Price history
| Date | Event | Price |
|---|---|---|
| 10/2/2026 | Price change | $89,900-10%$92/sqft |
Source:  MichRIC #26041072 Report a problem | ||
| 8/6/2026 | Listed for sale | $99,900+352%$103/sqft |
Source: MichRIC #26041072 Report a problem | ||
| 2/6/2024 | Listing removed | -- |
Source: Zillow Rentals Report a problem | ||
| 1/25/2024 | Listed for rent | $950+58.3%$1/sqft |
Source: Zillow Rentals Report a problem | ||
| 4/4/2018 | Listing removed | $600$1/sqft |
Source: Westshore Property Management, Inc. Report a problem | ||
| 4/2/2018 | Listed for rent | $600+14.3%$1/sqft |
Source: Westshore Property Management, Inc. Report a problem | ||
| 4/8/2014 | Listing removed | $525$1/sqft |
Source: ALT Property Management, LLC Report a problem | ||
| 11/20/2013 | Listed for rent | $525$1/sqft |
Source: ALT Property Management, LLC Report a problem | ||
| 12/16/2008 | Sold | $22,100-57.1%$23/sqft |
Source: Public Record Report a problem | ||
| 12/1/2004 | Sold | $51,575$53/sqft |
Source: Public Record Report a problem | ||
Public tax history
| Year | Property taxes | Tax assessment |
|---|---|---|
| 2026 | $680 +2.8% | $38,500 +10.3% |
| 2025 | $661 -13.7% | $34,900 +68.6% |
| 2024 | $766 +4.9% | $20,700 +38% |
| 2023 | $730 | $15,000 +5.6% |
| 2022 | -- | $14,200 +14.5% |
| 2021 | $704 | $12,400 +2.5% |
| 2020 | $704 +49.8% | $12,100 +505% |
| 2018 | $470 | $2,000 -77% |
| 2017 | -- | $8,700 -1.1% |
| 2016 | -- | $8,800 -3.3% |
| 2015 | -- | $9,100 -21.6% |
| 2014 | -- | $11,600 +2.7% |
| 2013 | -- | $11,300 -8.9% |
| 2012 | -- | $12,400 -52.3% |
| 2011 | -- | $26,000 |
| 2010 | -- | $26,000 -11% |
| 2009 | -- | $29,200 -1.4% |
| 2008 | -- | $29,600 +21.3% |
| 2007 | -- | $24,400 |
| 2006 | -- | $24,400 +6.1% |
| 2005 | -- | $23,000 -2.1% |
| 2004 | -- | $23,500 -8.6% |
| 2003 | -- | $25,700 +13.2% |
| 2002 | -- | $22,700 +4.6% |
| 2001 | -- | $21,700 +33.1% |
| 2000 | -- | $16,300 |
Find assessor info on the county website
Monthly payment
Est. payment
Payment breakdown
Explore the cost of this home by adjusting the details. Changes won't be saved.Climate risks
Neighborhood: 49444
- $104,2003 bd1 ba1.3k sqft2329 Leahy St, Muskegon Heights, MI 49444Off Market
- $70,3002 bd1 ba1.2k sqft2325 Leahy St, Muskegon Heights, MI 49444Off Market
- $208,4003 bd3 ba2.8k sqft2345 Leahy St, Muskegon Heights, MI 49444Off Market

- $77,2002 bd1 ba825 sqft2332 Baker St, Muskegon Heights, MI 49444Off Market
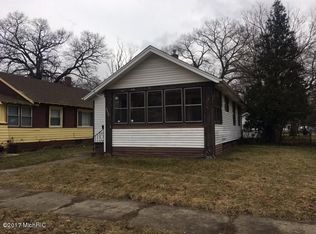
Similar homes
- $82,0002 bd1 ba1k sqft2401 Baker St, Muskegon Heights, MI 49444For Sale
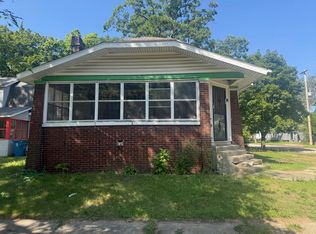
 MLS ID #26046451, Terri Kitchen, TLK Real Estate Inc.. MichRIC
- $--2 bd1 ba864 sqft2020 Manz St, Muskegon Heights, MI 49444Auction
 Auction.com 2
- $84,9002 bd1 ba888 sqft3036 7th St, Muskegon Heights, MI 49444For Sale
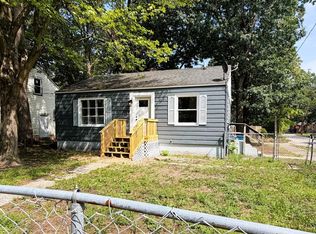 MLS ID #26046669, Anthony Nanna, Greenridge - Nexes. MichRIC
- $--3 bd1 ba912 sqft2225 Riordan St, Muskegon Heights, MI 49444Auction
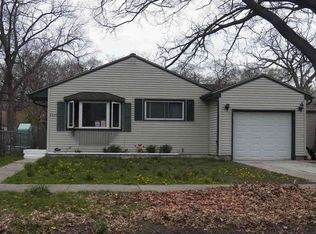 Xome
- $58,0002 bd1 ba1k sqft2337 6th St, Muskegon Heights, MI 49444For Sale
 MLS ID #50227316, Colton Rine, Five Star Real Estate. MiRealSource
- $79,9002 bd1 ba860 sqft358 E Columbia Ave, Muskegon Heights, MI 49444For SaleMLS ID #26054300, Bruce R Lindstrom, Bellabay Realty LLC. MichRIC
- $103,5002 bd1 ba878 sqft2818 Riordan St, Muskegon Heights, MI 49444For SaleMLS ID #26030356, Diana Carol Cain, RE/MAX West. MichRIC
- $119,9003 bd1 ba784 sqft2405 Riordan St, Muskegon Heights, MI 49444For SaleMLS ID #26048513, Veronika Anderson, RE/MAX West. MichRIC
- $59,9003 bd1 ba1k sqft2340 Sanford St, Muskegon Heights, MI 49444For SaleMLS ID #26048282, David B Crawford, Bellabay Realty LLC. MichRIC
- $104,9003 bd1 ba1.2k sqft2905 7th St, Muskegon Heights, MI 49444For SaleMLS ID #26053193, Anthony Nanna, Greenridge - Nexes. MichRIC
- $64,9001 bd1 ba616 sqft3316 Sanford St, Muskegon Heights, MI 49444For SaleMLS ID #26060025, Drake Johnson, Bellabay Realty LLC. MichRIC
- $114,9003 bd2 ba1k sqft2611 Wood St, Muskegon Heights, MI 49444For SaleMLS ID #26045742, Linda Sakocius, Epique Realty. MichRIC
- $125,5002 bd1 ba936 sqft2525 Reynolds St, Muskegon Heights, MI 49444For SaleMLS ID #26042547, Jason Gracik, Landmark Real Estate Group. MichRIC
- $119,9003 bd1 ba1.2k sqft2933 Leahy St, Muskegon Heights, MI 49444For SaleMLS ID #26049837, Megan Sharp, Five Star Real Estate. MichRIC
- $129,9003 bd1 ba925 sqft2304 Dyson St, Muskegon Heights, MI 49444For SaleMLS ID #26042073, Jason Ball, Century 21 Affiliated GR. MichRIC
- $79,9002 bd1 ba987 sqft1381 Madison St, Muskegon, MI 49442For SaleMLS ID #26048408, Kathryn Jo Bultema, Greenridge Realty White Lake. MichRIC
- $60,0002 bd1 ba676 sqft2937 8th St, Muskegon Heights, MI 49444For SaleMLS ID #26027571, Tammy Schuiling, Greenridge Realty (Summit). MichRIC
- $129,0002 bd1 ba864 sqft2820 Lemuel St, Muskegon Heights, MI 49444For SaleMLS ID #26059759, Trevor Bartkowiak, RE/MAX Lakeshore. MichRIC
- $133,0002 bd1 ba902 sqft2209 Leahy St, Muskegon Heights, MI 49444For SaleMLS ID #26011788, Betina P McDaniel, ERA Reardon Realty Great Lakes. MichRIC
- $110,0003 bd1 ba1k sqft2975 Bailey St, Muskegon, MI 49444For SaleMLS ID #26055746, Diana Carol Cain, RE/MAX West. MichRIC
