This 1246 square foot single family home has 3 bedrooms and 2.0 bathrooms. This home is located at 235 Fuller St, Shafter, CA 93263.
Pre-foreclosure
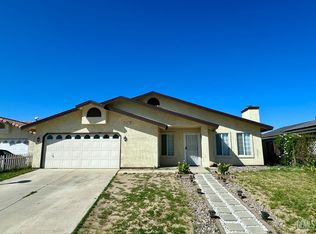
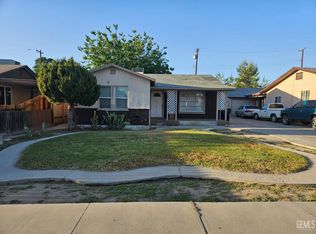
Street View
Est. $325,600
235 Fuller St, Shafter, CA 93263
3beds
2baths
1,246sqft
SingleFamily
Built in 1988
9,147 Square Feet Lot
$325,600 Zestimate®
$261/sqft
$-- HOA
Overview
- 74 days |
- 33 |
- 0 |
Facts & features
Interior
Bedrooms & bathrooms
- Bedrooms: 3
- Bathrooms: 2
Heating
- Wall
Cooling
- Other
Features
- Has fireplace: Yes
Interior area
- Total interior livable area: 1,246 sqft
Property
Parking
- Parking features: Garage - Attached
Lot
- Size: 9,147 Square Feet
Details
- Parcel number: 02844206
Construction
Type & style
- Home type: SingleFamily
Materials
- wood frame
Condition
- Year built: 1988
Community & HOA
Location
- Region: Shafter
Financial & listing details
- Price per square foot: $261/sqft
- Tax assessed value: $104,550
- Annual tax amount: $1,503
Visit our professional directory to find a foreclosure specialist in your area that can help with your home search.
Find a foreclosure agentForeclosure details
Estimated market value
$325,600
$303,000 - $345,000
$2,007/mo
Price history
| Date | Event | Price |
|---|---|---|
| 12/31/2009 | Sold | $97,000-58.7%$78/sqft |
Source: Public Record Report a problem | ||
| 4/28/2006 | Sold | $235,000$189/sqft |
Source: Public Record Report a problem | ||
Public tax history
| Year | Property taxes | Tax assessment |
|---|---|---|
| 2025 | $1,503 +1.7% | $104,550 +2% |
| 2024 | $1,477 +3.3% | $102,501 +2% |
| 2023 | $1,430 +4.4% | $100,492 +2% |
| 2022 | $1,369 | $98,523 +2% |
| 2021 | -- | $96,592 +1% |
| 2020 | $1,265 +0.2% | $95,603 |
| 2019 | $1,262 +3.8% | $95,603 +4% |
| 2018 | $1,217 +0.6% | $91,893 +2% |
| 2017 | $1,209 +5.8% | $90,092 +2% |
| 2016 | $1,143 +2.9% | $88,326 +1.5% |
| 2015 | $1,111 -5.7% | $87,000 -14.8% |
| 2014 | $1,179 | $102,135 +24.6% |
| 2013 | -- | $82,000 -10.9% |
| 2012 | $1,075 +0.1% | $92,082 |
| 2011 | $1,073 -5.5% | $92,082 -5.1% |
| 2010 | $1,136 -14.8% | $97,000 -15.2% |
| 2009 | $1,334 -36.1% | $114,326 -38.5% |
| 2008 | $2,086 -20.4% | $185,810 -20.9% |
| 2007 | $2,622 +121.6% | $235,000 +146.5% |
| 2006 | $1,183 +1.5% | $95,337 +2% |
| 2005 | $1,165 +4% | $93,468 |
| 2004 | $1,120 +3.8% | $93,468 +1.9% |
| 2003 | $1,079 | $91,756 +4% |
| 2002 | $1,079 +5.7% | $88,196 +2% |
| 2001 | $1,020 | $86,467 |
| 2000 | -- | $86,467 |
Find assessor info on the county website
Monthly payment
Estimated monthly payment$1,822
All calculations are estimates and provided by Zillow, Inc. for informational purposes only. Actual amounts may vary.
HOA fees may include property taxes on listings classified as Co-Ops. Contact the listing agent and/or owner for fee details.
Mortgage interest rates are dependent on a number of factors, including credit score, down payment, and repayment length. Interest rate data provided by Zillow Group Marketplace, Inc. as of 1/1/1970 from various mortgage lenders with which we have lead or other similar arrangements; the Estimated Payment is an average of those rates.
See how much you could borrow to make a competitive offer.
Climate risks
Neighborhood: 93263
Nearby schools
GreatSchools rating
- 4/10Golden Oak Elementary SchoolGrades: K-6Distance: 0.2 mi
- 3/10Richland Junior High SchoolGrades: 7-8Distance: 0.4 mi
- 5/10Shafter High SchoolGrades: 9-12Distance: 0.9 mi


- California
- Kern County
- Shafter
- 93263
- 235 Fuller St
Nearby cities
Nearby zip codes
Other Shafter Topics
