This piece of land is 5 acres of immense potential. This piece of land is already developed, there will be no impact fee when you build here! This property is zoned for rural (R-1), along with the entire Black Hammock, so developers cannot come into the neighborhood and build cookie cutter houses right next door. And no commercial use. This is a great location to build a house and have tons of room. It's far enough away from suburbia but close enough to civilization, there's a publix just over 10 minutes away.
For sale by owner
$300,000
2351 Canal St, Oviedo, FL 32765
1beds
0baths
5.38Acres
VacantLand
Built in 1990
5.38 Acres Lot
$248,000 Zestimate®
$466/sqft
$-- HOA
What's special
Close enough to civilizationAlready developed
- 37 days
- 936
- 111
Listed by:
Property Owner (407) 620-6360
Facts & features
Interior
Bedrooms & bathrooms
- Bedrooms: 1
- Bathrooms: 0
Heating
- Other
Cooling
- Central
Features
- Flooring: Other, Hardwood
Interior area
- Total interior livable area: 644 sqft
Property
Features
- Exterior features: Other
Lot
- Size: 5.38 Acres
Details
- Parcel number: 2520315BA0000123A
Community & HOA
Location
- Region: Oviedo
Financial & listing details
- Price per square foot: $466/sqft
- Tax assessed value: $239,090
- Annual tax amount: $3,242
- Date on market: 9/17/2026
Estimated market value
$248,000
$221,000 - $280,000
Not available
Price history
| Date | Event | Price |
|---|---|---|
| 9/17/2026 | Listed for sale | $300,000+36.4%$466/sqft |
Source: Owner Report a problem | ||
| 12/29/2022 | Sold | $220,000$342/sqft |
Source: Public Record Report a problem | ||
Public tax history
| Year | Property taxes | Tax assessment |
|---|---|---|
| 2025 | $3,242 +25.4% | $200,951 +10% |
| 2024 | $2,585 +17% | $182,683 +10% |
| 2023 | $2,210 +7.5% | $166,075 +8.3% |
| 2022 | $2,057 +257.1% | $153,403 +196.6% |
| 2021 | $576 +1.1% | $51,729 +1.4% |
| 2020 | $570 +0.5% | $51,015 +2.3% |
| 2019 | $567 +90.4% | $49,868 +1.9% |
| 2018 | $298 -9% | $48,938 +2.1% |
| 2017 | $327 -0.9% | $47,931 +1.4% |
| 2016 | $330 +1.1% | $47,274 +1.4% |
| 2015 | $327 +1.4% | $46,619 +0.8% |
| 2014 | $322 +0.3% | $46,249 +1.5% |
| 2013 | $321 +8.2% | $45,566 +1.7% |
| 2012 | $297 +6.1% | $44,804 +3% |
| 2011 | $280 +2.6% | $43,499 +1.5% |
| 2010 | $273 +7.5% | $42,856 +2.7% |
| 2009 | $254 +4% | $41,729 +0.1% |
| 2008 | $244 +10.2% | $41,687 +3% |
| 2007 | $221 -1.9% | $40,473 +2.5% |
| 2006 | $225 +7.2% | $39,486 +3% |
| 2005 | $210 +6.2% | $38,336 +3% |
| 2004 | $198 +4.8% | $37,219 +1.9% |
| 2003 | $189 +6.7% | $36,525 +2.4% |
| 2002 | $177 +10.3% | $35,669 +4.7% |
| 2000 | $161 | $34,084 |
Find assessor info on the county website
Monthly payment
Est. payment
Payment breakdown
Explore the cost of this home by adjusting the details. Changes won't be saved.Climate risks
Neighborhood: 32765
Similar homes
- $425,0005.17 acres2295 CANAL STREET LOT 124, OVIEDO, FL 32765Lot/Land
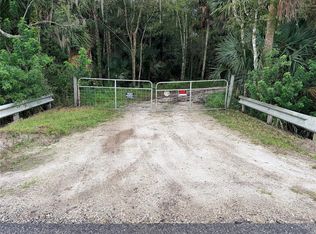
 MLS ID #V4951897, Jeff Bell, LANDSHARK REALTY. Stellar MLS
- $300,0004.28 acresPANTHER STREET LOT 149, OVIEDO, FL 32765Lot/Land
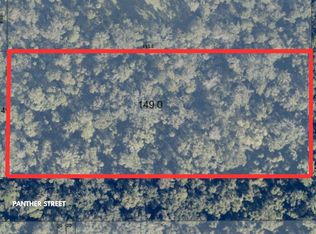 MLS ID #O6351478, Yashmit Gutierrez, EXP REALTY LLC. Stellar MLS
- $325,0008.88 acres601 HOWARD AVENUE LOT 91, OVIEDO, FL 32765Lot/Land
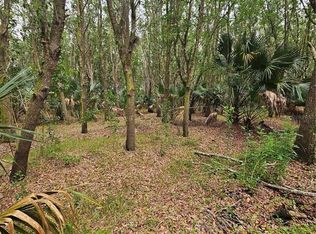 MLS ID #O6407743, Jamie Langford, COLDWELL BANKER REALTY. Stellar MLS
- $245,0004.78 acresORANGE ST/SEC 1, OVIEDO, FL 32765Lot/Land
 MLS ID #O6247217, Stephanie Nelson. eXp Realty
- $219,0009.4 acresSTONE STREET LOT 358, OVIEDO, FL 32765Lot/LandMLS ID #O6428500, Jenny Wemert, WEMERT GROUP REALTY LLC. Stellar MLS
- $245,0004.78 acresORANGE ST/SEC 1 LOT 324, OVIEDO, FL 32765Lot/LandMLS ID #O6247217, Stephanie Nelson, EXP REALTY LLC. Stellar MLS
- $300,0006.23 acresIRON BRIDGE ROAD, OVIEDO, FL 32765Lot/LandMLS ID #O6424146, Nancy Rossman, FLORIDA PROPERTY SPECIALIST. Stellar MLS
- $299,9995.24 acres1707 KIMMIE KAY DRIVE LOT 11, GENEVA, FL 32732Lot/LandMLS ID #G5118335, Mo Mufti, LPT REALTY, LLC. Stellar MLS
- $375,0004.16 acresMECCA HAMMOCK TRAIL LOT 70, SANFORD, FL 32773Lot/LandMLS ID #O6439087, Jennifer Nadwornik, KELLER WILLIAMS ADVANTAGE REALTY. Stellar MLS
- $382,0009.31 acres5950 S SANFORD AVE LOT 8, SANFORD, FL 32773Lot/LandMLS ID #TB8554106, Benjamin Toaff, NEX-GEN FLORIDA REALTY, INC.. Stellar MLS
- $365,0003.97 acres620 COCHRAN ROAD, GENEVA, FL 32732Lot/LandMLS ID #O6419713, Paula Billingsley, SEMINOLE WOODS REALTY, INC.. Stellar MLS
- $299,9003.56 acresPINE WAY #Lot 4E, SANFORD, FL 32773Lot/LandMLS ID #O6220396, Mary Marwick, PREMIUM PROPERTIES R.E SERVICE. Stellar MLS
- $440,0004.98 acres2415 WACCASSA STREET LOT 17,A, GENEVA, FL 32732Lot/LandMLS ID #O6447223, Evelyn Tejada, REGENCY REAL ESTATE LLC. Stellar MLS
- $349,9005 acres541 E OSCEOLA ROAD, GENEVA, FL 32732Lot/LandMLS ID #O6388611, Tina Scott, COLDWELL BANKER REALTY. Stellar MLS
- $289,0008 acres1061 ENTERPRISE OSTEEN ROAD LOT 3, DELTONA, FL 32725Lot/LandMLS ID #O5880943, James Lettieri, KROLL REALTY GROUP. Stellar MLS
- $175,0006.41 acres2401 CANVASBACK TRAIL LOT 38, GENEVA, FL 32732Lot/LandMLS ID #O6420671, Brad Merrell, COLDWELL BANKER REALTY. Stellar MLS
- $155,0005.66 acresCANVASBACK TRAIL LOT 5, GENEVA, FL 32732Lot/LandMLS ID #O6420744, Brad Merrell, COLDWELL BANKER REALTY. Stellar MLS
- $260,0007 acres0 DOYLE ROAD LOT 50 30, DELTONA, FL 32738Lot/LandMLS ID #V4946461, Heather Hinson, GREENE REALTY OF FLORIDA LLC. Stellar MLS
- $395,0008 acres345 TROTTING TRAIL, OSTEEN, FL 32764Lot/LandMLS ID #O6426323, Taylor Benfield, DESIGN OR LIST IT INC. Stellar MLS
