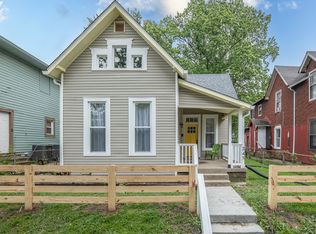
Come create your dream residence in this up-and-coming Near-Eastside neighborhood. Vacant lot ready for your own vision. Situated a short distance from Downtown Indy, this area is undergoing a rapid revitalization. Ideal for investors or buyers.
Sold
Zillow last checked:
Listing updated:
Bought with:
Matthew Schumacker
eXp Realty LLC
Source: MIBOR as distributed by MLS GRID,MLS#: 22086327
Price history
| Date | Event | Price |
|---|---|---|
| 9/17/2026 | Sold | $40,500-32.5% |
Source:  MIBOR as distributed by MLS GRID #22086327 Report a problem MIBOR as distributed by MLS GRID #22086327 Report a problem | ||
| 5/30/2026 | Pending sale | $60,000 |
Source: MIBOR as distributed by MLS GRID #22086327 Report a problem | ||
| 4/2/2026 | Price change | $60,000-7.7% |
Source: MIBOR as distributed by MLS GRID #22086327 Report a problem | ||
| 3/1/2026 | Listed for sale | $65,000+44.4% |
Source: MIBOR as distributed by MLS GRID #22086327 Report a problem | ||
| 10/4/2025 | Listing removed | $45,000 |
Source: MIBOR as distributed by MLS GRID #22005083 Report a problem | ||
| 4/1/2025 | Price change | $45,000-10% |
Source: MIBOR as distributed by MLS GRID #22005083 Report a problem | ||
| 10/4/2024 | Listed for sale | $50,000+177.8% |
Source: MIBOR as distributed by MLS GRID #22005083 Report a problem | ||
| 9/16/2020 | Sold | $18,000 |
Source: Public Record Report a problem | ||