Opportunity awaits with this 3-bedroom, 1-bath home offering 838 square feet of living space! This property is in need of significant repairs and renovations, making it an ideal opportunity for investors or buyers looking for their next renovation project. Situated on an approximately 0.16-acre lot, the property offers outdoor space with potential for future improvements. With no HOA and plenty of possibilities to transform this property, bring your vision and explore the potential! Property is being sold as-is. Schedule your showing today!
For sale
$159,900
2378 Millerton St, Columbus, OH 43232
3beds
838sqft
Single Family Residence
Built in 1970
7,840 Square Feet Lot
$-- Zestimate®
$191/sqft
$-- HOA
What's special
Outdoor space
- 7 days
- 151
- 3
Likely to sell faster than
Zillow last checked:
Listing updated:
Listed by:
Michael Mcgee 678-846-2807,
Mainstay Brokerage LLC
Source: Columbus and Central Ohio Regional MLS ,MLS#: 226040899
Facts & features
Interior
Bedrooms & bathrooms
- Bedrooms: 3
- Bathrooms: 1
- Full bathrooms: 1
- Main level bedrooms: 3
Features
- Basement: Crawl Space,Partial
- Common walls with other units/homes: No Common Walls
Interior area
- Total structure area: 838
- Total interior livable area: 838 sqft
Property
Features
- Levels: One
Lot
- Size: 7,840 Square Feet
Details
- Parcel number: 010154822
Construction
Type & style
- Home type: SingleFamily
- Architectural style: Ranch
- Property subtype: Single Family Residence
Materials
- Foundation: Block
Condition
- New construction: No
- Year built: 1970
Utilities & green energy
- Sewer: Public Sewer
- Water: Public
Community & HOA
Community
- Subdivision: Lexington
HOA
- Has HOA: No
Location
- Region: Columbus
Financial & listing details
- Price per square foot: $191/sqft
- Tax assessed value: $124,900
- Annual tax amount: $2,010
- Date on market: 10/28/2026
Estimated market value
Not available
Estimated sales range
Not available
Not available
Price history
| Date | Event | Price |
|---|---|---|
| 10/28/2026 | Listed for sale | $159,900+46.7%$191/sqft |
Source:  Columbus and Central Ohio Regional MLS #226040899 Report a problem | ||
| 10/20/2021 | Sold | $109,000-8.9%$130/sqft |
Source: Columbus and Central Ohio Regional MLS #221034821 Report a problem | ||
| 10/6/2021 | Contingent | $119,700$143/sqft |
Source: Columbus and Central Ohio Regional MLS #221034821 Report a problem | ||
| 9/28/2021 | Price change | $119,700-0.2%$143/sqft |
Source: Columbus and Central Ohio Regional MLS #221034821 Report a problem | ||
| 9/3/2021 | Listed for sale | $119,900+151%$143/sqft |
Source: Columbus and Central Ohio Regional MLS #221034821 Report a problem | ||
| 10/10/2020 | Listing removed | $899$1/sqft |
Source: Zillow Rental Manager Report a problem | ||
| 10/5/2020 | Listed for rent | $899$1/sqft |
Source: Zillow Rental Manager Report a problem | ||
| 8/23/2006 | Sold | $47,775+8.6%$57/sqft |
Source: Public Record Report a problem | ||
| 5/12/2006 | Sold | $44,000+8.6%$53/sqft |
Source: Public Record Report a problem | ||
| 1/11/1996 | Sold | $40,500$48/sqft |
Source: Public Record Report a problem | ||
Public tax history
| Year | Property taxes | Tax assessment |
|---|---|---|
| 2025 | $2,010 +0.3% | $43,720 |
| 2024 | $2,004 +1.3% | $43,720 |
| 2023 | $1,979 +140.7% | $43,720 +182.6% |
| 2022 | $822 -0.2% | $15,470 |
| 2021 | $824 -0.2% | $15,470 |
| 2020 | $825 +13.4% | $15,470 +32.2% |
| 2019 | $728 +0.2% | $11,700 |
| 2018 | $726 | $11,700 |
| 2017 | $726 +36.9% | $11,700 +49.8% |
| 2016 | $531 -0.5% | $7,810 |
| 2015 | $533 | $7,810 |
| 2014 | $533 +123.2% | $7,810 +0.1% |
| 2013 | $239 -77.2% | $7,805 -55.3% |
| 2011 | $1,045 -24.8% | $17,465 -28.5% |
| 2010 | $1,391 +6.4% | $24,430 |
| 2008 | $1,307 +5.4% | $24,430 |
| 2007 | $1,240 +13% | -- |
| 2006 | $1,097 +4.2% | -- |
| 2005 | $1,053 +14.9% | -- |
| 2004 | $916 +20.1% | -- |
| 2003 | $763 +0.4% | -- |
| 2002 | $760 +6.9% | -- |
| 2001 | $710 -0.5% | -- |
| 2000 | $714 | -- |
Find assessor info on the county website
Monthly payment
Est. payment
Payment breakdown
Explore the cost of this home by adjusting the details. Changes won't be saved.Climate risks
Neighborhood: Glenbrook
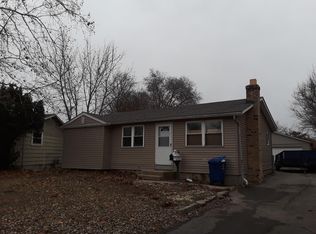


Similar homes
- $175,0003 bd1 ba993 sqft2094 Wadsworth Dr, Columbus, OH 43232For Sale
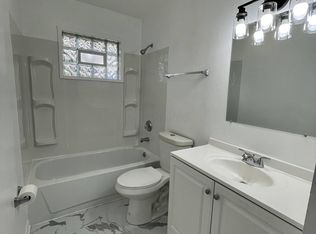
 MLS ID #226041357, Aaron J McDaniel, Mainstream Realty Pros. Columbus and Central Ohio Regional MLS
- $179,9003 bd1 ba1.1k sqft3426 Bruceton Ave, Columbus, OH 43232For Sale
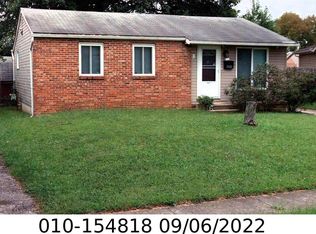 MLS ID #226038243, Chanston Moll, Key Realty. Columbus and Central Ohio Regional MLS
- $169,9003 bd1 ba1.1k sqft3559 Noe Bixby Rd, Columbus, OH 43232For Sale
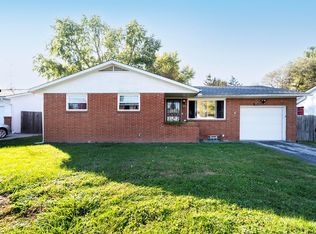 MLS ID #226041339, Dylan J Knecht, RE/MAX Revealty. Columbus and Central Ohio Regional MLS
- $139,9003 bd1 ba836 sqft3385 Bruceton Ave, Columbus, OH 43232For Sale
 MLS ID #226028362, Lisa Pulsfort, Trelora Realty, Inc. Columbus and Central Ohio Regional MLS
- $154,9003 bd2 ba936 sqft3710 Beechton Rd, Columbus, OH 43232For SaleMLS ID #226038955, Richard Freeman, Coldwell Banker Realty. Columbus and Central Ohio Regional MLS
- $168,0003 bd1 ba936 sqft3700 Laguna Dr, Columbus, OH 43232For SaleMLS ID #226040159, Carlos D Ellis, Unique Realty Consultants. Columbus and Central Ohio Regional MLS
- $179,9003 bd1 ba891 sqft3483 Penfield Rd, Columbus, OH 43227For SaleMLS ID #226039008, Michael Mcgee, Mainstay Brokerage LLC. Columbus and Central Ohio Regional MLS
- $169,9003 bd2 ba1.1k sqft1688 Penfield Rd, Columbus, OH 43227For SaleMLS ID #226035319, Krista L Mathers, NextHome Experience. Columbus and Central Ohio Regional MLS
- $179,9003 bd1 ba1k sqft5400 Bleaker Ave, Columbus, OH 43232For SaleMLS ID #226036352, Kendra Hall, Move Real Estate. Columbus and Central Ohio Regional MLS
- $144,9003 bd1 ba912 sqft1731 Burlington Ave, Columbus, OH 43227For SaleMLS ID #226033468, Eva Marie Hockenberry, Mainstay Brokerage LLC. Columbus and Central Ohio Regional MLS
- $189,9003 bd2 ba1.1k sqft1831 Woodcrest Rd, Columbus, OH 43232For SaleMLS ID #226033063, Wanneese D Brown, Red 1 Realty. Columbus and Central Ohio Regional MLS
- $159,9003 bd1 ba971 sqft595 S Waverly St, Columbus, OH 43213For SaleMLS ID #226038392, Mark D Corbin, NextHome Experience. Columbus and Central Ohio Regional MLS
- $164,9003 bd1 ba1.1k sqft835 S Hampton Rd, Columbus, OH 43227For SaleMLS ID #226038589, Eva Marie Hockenberry, Mainstay Brokerage LLC. Columbus and Central Ohio Regional MLS
- $182,5003 bd2 ba984 sqft1461 Courtright Rd, Columbus, OH 43227For SaleMLS ID #226035536, Brandon Thompson, Red 1 Realty. Columbus and Central Ohio Regional MLS
- $199,9003 bd2 ba1.1k sqft3092 Falcon Bridge Dr, Columbus, OH 43232For SaleMLS ID #226040401, Dylan J Knecht, RE/MAX Revealty. Columbus and Central Ohio Regional MLS
