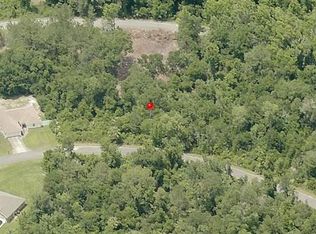
Ready to build your dream home on this prime vacant lot! AMAZING OPPORTUNITY in Silver Springs Shores Unit 8! This prime vacant lot is located directly within the Marion County "Septic to Sewer" Phase 2 Program Area, meaning CENTRAL WATER and PUBLIC SEWER are available for connection. Avoid the future hassle of private well drilling or septic tank maintenance! The Marion County Resolution 24-R-303, utility connection surcharges for this undeveloped parcel are capped at a maximum of $5,000 for water and $12,500 for sewer, due at the time of future building connection. Official county document is available upon request. Drive by and check out this build-ready location today!
Lot/land
$49,000
238 BAHIA CIRCLE LOT 3, OCALA, FL 34472
--beds
0baths
0.33Acres
Unimproved Land
Built in ----
0.33 Acres Lot
$-- Zestimate®
$--/sqft
$-- HOA
What's special
Prime vacant lotBuild-ready location
- 9 days
- 65
- 10
Zillow last checked:
Listing updated:
Listed by:
Rose Hutchinson 352-361-8090,
WATSON REALTY CORP 352-624-9300
Source: Stellar MLS,MLS#: OM733781 Originating MLS: Ocala - Marion
Facts & features
Interior
Bedrooms & bathrooms
- Bathrooms: 0
Property
Lot
- Size: 0.33 Acres
- Dimensions: 100 x 144
Details
- Parcel number: 9008002503
- Zoning: R1
- Special conditions: None
Utilities & green energy
- Sewer: Public Sewer
- Water: Public
- Utilities for property: Electricity Available, Public, Sewer Available, Water Available
Community & HOA
Community
- Pet fee: $0 monthly
- Subdivision: SILVER SPGS SHORES UN #8
HOA
- Has HOA: No
Location
- Region: Ocala
Financial & listing details
- Tax assessed value: $27,000
- Annual tax amount: $481
- Date on market: 10/9/2026
- Cumulative days on market: 10 days
- Listing terms: Cash,Conventional
- Ownership: Fee Simple
- Total actual rent: 0
- Electric utility on property: Yes
- Road surface type: Asphalt
Estimated market value
Not available
Estimated sales range
Not available
Not available
Price history
| Date | Event | Price |
|---|---|---|
| 10/9/2026 | Listed for sale | $49,000+4.5% |
Source:  Stellar MLS #OM733781 Report a problem | ||
| 7/21/2026 | Listing removed | $46,900 |
Source: Stellar MLS #OM716506 Report a problem | ||
| 1/12/2026 | Listed for sale | $46,900+61.8% |
Source: Stellar MLS #OM716506 Report a problem | ||
| 11/4/2024 | Sold | $28,995-3.3% |
Source: Stellar MLS #O6219859 Report a problem | ||
| 8/14/2024 | Pending sale | $29,995 |
Source: Stellar MLS #O6219859 Report a problem | ||
| 7/2/2024 | Listed for sale | $29,995+51.2% |
Source: Stellar MLS #O6219859 Report a problem | ||
| 4/5/2024 | Sold | $19,843 |
Source: Public Record Report a problem | ||
Public tax history
| Year | Property taxes | Tax assessment |
|---|---|---|
| 2025 | $481 +76% | $27,000 +236.7% |
| 2024 | $273 +4.1% | $8,018 +10% |
| 2023 | $262 +20% | $7,289 +10% |
| 2022 | $219 +18.2% | $6,626 +10% |
| 2021 | $185 +13.3% | $6,024 +10% |
| 2020 | $163 +2.2% | $5,476 +10% |
| 2019 | $160 | $4,978 -23.4% |
| 2018 | $160 +12.4% | $6,500 +18.2% |
| 2017 | $142 +16.7% | $5,500 +47.1% |
| 2016 | $122 | $3,740 +10% |
| 2015 | $122 +3.2% | $3,400 +3% |
| 2014 | $118 +5.4% | $3,300 +10% |
| 2013 | $112 -6.3% | $3,000 -14.3% |
| 2012 | $120 -13.6% | $3,500 -25.5% |
| 2011 | $138 -9.3% | $4,701 -16.7% |
| 2010 | $152 -20.6% | $5,641 -33.3% |
| 2009 | $192 -52.4% | $8,461 -63.3% |
| 2008 | $403 -37.5% | $23,031 -41.3% |
| 2007 | $645 +17.5% | $39,254 +33.3% |
| 2006 | $549 +151.7% | $29,441 +315.4% |
| 2005 | $218 | $7,088 -13.3% |
| 2004 | $218 +11.7% | $8,178 |
| 2002 | $195 +45.9% | $8,178 +36.4% |
| 2001 | $134 | $5,997 |
| 2000 | $134 | $5,997 |
Find assessor info on the county website
Monthly payment
Climate risks
Neighborhood: 34472
Similar homes
- $37,0000.3 acresPINE COURSE RUN LOT 1, OCALA, FL 34472Lot/Land

 MLS ID #OM732473, Asher Abadi, UDI LLC. Stellar MLS
- $29,9000.29 acres0 BAHIA CIRCLE LANE LOT 7, OCALA, FL 34472Lot/Land
 MLS ID #O6405435, Christina Almquist, CHRISTINA ALMQUIST, LIC BROKER. Stellar MLS
- $28,00010,019 sqft234 OAK LANE WAY LOT 6, OCALA, FL 34472Lot/Land
 MLS ID #G5118707, Karen Kamperman, KELLER WILLIAMS CORNERSTONE RE. Stellar MLS
- $28,00010,454 sqft216 EMERALD LOOP WAY LOT 23, OCALA, FL 34472Lot/Land
 MLS ID #G5118705, Karen Kamperman, KELLER WILLIAMS CORNERSTONE RE. Stellar MLS
- $43,0000.62 acresSILVER SPRINGS SHORES UNIT16 LOT 16, OCALA, FL 34472Lot/LandMLS ID #TB8546336, Charlynn Ramirez, GAVIN REALTY INC.. Stellar MLS
- $33,50010,019 sqft47 BAHIA COURT TRACK LOT 3, OCALA, FL 34472Lot/LandMLS ID #FC316360, Savannah Umpenhour, CHARLES UMPENHOUR INC. Stellar MLS
- $49,9000.25 acres0 DOGWOOD ROAD LOT 15, OCALA, FL 34472Lot/LandMLS ID #OM727405, Jose Mateo, RE/MAX FOXFIRE - HWY 40. Stellar MLS
- $39,9000.45 acresOAK PASS LOOP LOT 4, OCALA, FL 34472Lot/LandMLS ID #OM686144, Rosa Rivera Carrero, GLOBALWIDE REALTY LLC. Stellar MLS
- $37,5000.3 acresTBD OAK CIRCLE LANE LOT 8, OCALA, FL 34472Lot/LandMLS ID #OM731255, Madeline Franco-Sofield, PREMIER SOTHEBY'S INTERNATIONAL REALTY. Stellar MLS
- $42,00010,019 sqftLot 32 SPRUCE PASS LOT 32, OCALA, FL 34472Lot/LandMLS ID #OM707777, Cleedia Huff, QUARTER STONE REALTY, LLC. Stellar MLS
- $34,00010,019 sqft26 PINE RUN LOT 3, OCALA, FL 34472Lot/LandMLS ID #OM693207, Courtney Moody, NEXTHOME PROFESSIONAL REALTY. Stellar MLS
- $35,0000.26 acresTBD HEMLOCK RADIAL TRAIL LOT 3, OCALA, FL 34472Lot/LandMLS ID #OM715840, Remy Perez, HOOK & LADDER REALTY OF CENTRAL FLORIDA, LLC. Stellar MLS
- $29,9000.41 acresLOCUST CRS LOT 11, OCALA, FL 34472Lot/LandMLS ID #OM729295, Maria Cardenas, GLOBALWIDE REALTY LLC. Stellar MLS
- $39,9008,712 sqft0 DOGWOOD DR CIRCLE LOT 22, OCALA, FL 34472Lot/LandMLS ID #OM698954, Gregory Miller, WEICHERT REALTORS HALLMARK PROPERTIES. Stellar MLS
- $32,0000.36 acres(TBD 202) LOCUST RD LOT 6, OCALA, FL 34472Lot/LandMLS ID #V4947951, Barbara Niles, CHAMPION REALTY OF FLORIDA LLC. Stellar MLS
- $28,50010,019 sqftTBD LOCUST LOOP TERRACE LOT 6, OCALA, FL 34472Lot/LandMLS ID #OM720445, Miesha Washington, DALTON WADE INC. Stellar MLS
- $50,0000.36 acres0 SE 105TH PLACE LOT 29, BELLEVIEW, FL 34420Lot/LandMLS ID #O6359895, Richard Gailey, GAILEY ENTERPRISES REAL ESTATE. Stellar MLS
- $29,9000.76 acresTBD LOCUST COURSE RADIAL LOT 20 LOT 20, OCALA, FL 34472Lot/LandMLS ID #OM704481, Madison Allen, HOMERUN REALTY. Stellar MLS
- $31,90010,019 sqftLOCUST RUN DRIVE LOT 43, OCALA, FL 34472Lot/LandMLS ID #G5111025, Kendall Vansant, OLYMPUS EXECUTIVE REALTY INC. Stellar MLS
