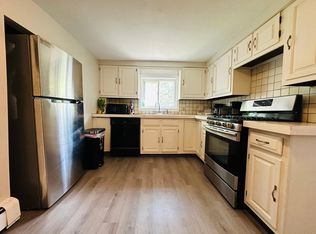
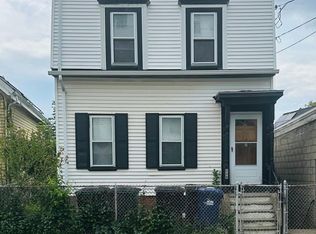
***$10,000 BUYERS CREDIT AT CLOSING*** HUGE HUGE single family property two full bathroom. Three levels of living space. First floor have a nice kitchen, hardwood floor, Four bedrooms. Second floor have two bedrooms, full bathroom, with yard space. Next to Orient heights train station, 10 minites to Logan Airport
For sale
$890,000
239 Leyden St, East Boston, MA 02128
6beds
2,046sqft
Single Family Residence
Built in 1900
2,046 Square Feet Lot
$-- Zestimate®
$435/sqft
$-- HOA
What's special
Yard spaceHardwood floorFour bedroomsNice kitchen
- 9 days
- 309
- 8
Likely to sell faster than
Zillow last checked:
Listing updated:
Listed by:
Jocelyn Auguste 617-453-8228,
Bohio Realty LLC 617-935-0527
Source: MLS PIN,MLS#: 73595177
Facts & features
Interior
Bedrooms & bathrooms
- Bedrooms: 6
- Bathrooms: 2
- Full bathrooms: 2
Bedroom 2
- Level: First
Bedroom 3
- Level: First
Bedroom 4
- Level: First
Bedroom 5
- Level: Second
Bathroom 1
- Level: First
Bathroom 2
- Level: Second
Dining room
- Level: First
Family room
- Level: First
Kitchen
- Level: Basement
Living room
- Level: First
Heating
- Forced Air
Cooling
- None
Features
- Bedroom, Kitchen
- Basement: Partially Finished
- Has fireplace: No
Interior area
- Total structure area: 2,046
- Total interior livable area: 2,046 sqft
- Finished area above ground: 2,046
Property
Parking
- Total spaces: 1
- Parking features: Garage
- Garage spaces: 1
Features
- Waterfront features: Harbor, River, 1 to 2 Mile To Beach, Beach Ownership(Public)
Lot
- Size: 2,046 Square Feet
- Features: Corner Lot
Details
- Parcel number: 1328615
- Zoning: RE
Construction
Type & style
- Home type: SingleFamily
- Architectural style: Other (See Remarks)
- Property subtype: Single Family Residence
Materials
- Foundation: Concrete Perimeter
Condition
- Year built: 1900
Utilities & green energy
- Sewer: Public Sewer
- Water: Public
Community & HOA
HOA
- Has HOA: No
Location
- Region: East Boston
Financial & listing details
- Price per square foot: $435/sqft
- Tax assessed value: $655,600
- Annual tax amount: $8,129
- Date on market: 10/26/2026
Estimated market value
Not available
Estimated sales range
Not available
$3,584/mo
Price history
| Date | Event | Price |
|---|---|---|
| 10/26/2026 | Listed for sale | $890,000+117.1%$435/sqft |
Source: MLS PIN #73595164 Report a problem | ||
| 9/13/2018 | Sold | $410,000+134.3%$200/sqft |
Source: Public Record Report a problem | ||
| 10/8/1999 | Sold | $175,000+23.2%$86/sqft |
Source: Public Record Report a problem | ||
| 4/21/1987 | Sold | $142,000$69/sqft |
Source: Public Record Report a problem | ||
Public tax history
| Year | Property taxes | Tax assessment |
|---|---|---|
| 2025 | $7,096 +19.4% | $612,800 +12.4% |
| 2024 | $5,944 +1.5% | $545,300 |
| 2023 | $5,857 +4.6% | $545,300 +6% |
| 2022 | $5,598 +7.1% | $514,500 +5% |
| 2021 | $5,228 +4.7% | $490,000 +3.6% |
| 2020 | $4,995 +9.5% | $473,000 +9.3% |
| 2019 | $4,560 +9.7% | $432,600 +9% |
| 2018 | $4,158 +890.3% | $396,800 +11% |
| 2017 | $420 -88.5% | $357,500 +8% |
| 2016 | $3,641 +8.8% | $331,000 +19.8% |
| 2015 | $3,346 +9.8% | $276,300 +19.1% |
| 2013 | $3,048 -1.3% | $232,000 -2% |
| 2012 | $3,088 +5.1% | $236,800 +3% |
| 2011 | $2,939 +6.5% | $229,800 -1% |
| 2010 | $2,759 -10.6% | $232,200 -20% |
| 2009 | $3,086 -17.5% | $290,300 -14.9% |
| 2008 | $3,741 -8.3% | $341,000 -8.1% |
| 2007 | $4,079 | $371,200 |
Find assessor info on the county website
Monthly payment
Est. payment
Payment breakdown
Explore the cost of this home by adjusting the details. Changes won't be saved.Climate risks
Neighborhood: East Boston
Similar homes
- $749,9745 bd2 ba1.5k sqft1203 Bennington St, East Boston, MA 02128For Sale
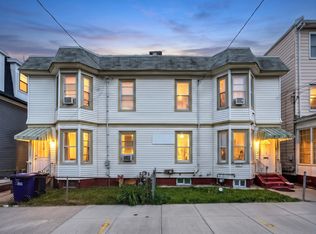 MLS ID #73593618, Mission Impossible Team, United Brokers. MLS PIN
- $849,0006 bd3 ba2.5k sqft34 Trenton St, East Boston, MA 02128For Sale
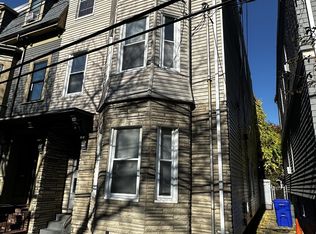 MLS ID #73597079, Alked Mira, EVO Real Estate Group, LLC. MLS PIN
- $895,0006 bd1 ba3k sqft126 Leyden St, East Boston, MA 02128For Sale
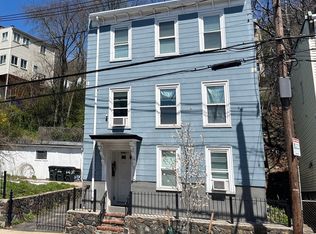 MLS ID #73519642, Evan Griffith, Marcus & Millichap Real Estate Investment Services. MLS PIN
- $850,0004 bd3 ba1.8k sqft551 Bennington St, East Boston, MA 02128For Sale
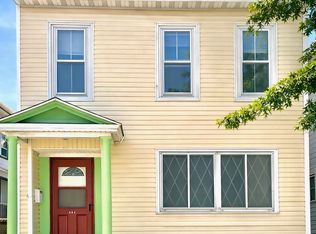 MLS ID #73542404, Kevin Alen, Cameron Prestige, LLC. MLS PIN
