This beautiful, completely remodeled 4-bedroom, 2-bathroom home in Desert Lake, Boron has everything you need and is move-in ready. The home features new flooring throughout, fresh interior paint, new carpet, a new roof, and all-new appliances. The kitchen has been completely updated with granite countertops, easy-close cabinets, and modern finishes. New light fixtures throughout add a fresh, updated feel to the home. Conveniently located near Highway 58 and the Rio Tinto Mine, this home offers both comfort and convenience. This is a must-see property that has been beautifully remodeled and is ready for its new owners.
For sale
$285,000
24230 Chaparral Ave, Boron, CA 93516
4beds
1,350sqft
Residential, Single Family Residence
Built in 1957
9,461 Square Feet Lot
$269,600 Zestimate®
$211/sqft
$-- HOA
What's special
New roofModern finishesNew flooring throughoutFresh interior paintNew carpetAll-new appliancesNew light fixtures throughout
- 71 days
- 169
- 6
Zillow last checked:
Listing updated:
Listed by:
Alana M. Barboa 661-972-4497,
Re/Max All-Pro
Source: TAAR,MLS#: 9994429Originating MLS: Tehachapi MLS
Facts & features
Interior
Bedrooms & bathrooms
- Bedrooms: 4
- Bathrooms: 2
- Full bathrooms: 2
Rooms
- Room types: Bedroom 2, Bedroom 3, Family Room, Great Room, Kitchen, Laundry, Mud Room, Sunroom
Interior area
- Total structure area: 1,350
- Total interior livable area: 1,350 sqft
Property
Parking
- Parking features: No Garage
Features
- Levels: One
- Pool features: None
Lot
- Size: 9,461 Square Feet
- Features: Cleared, Level
Details
- Parcel number: 23218311
- Lease amount: $0
- Zoning: R1
Construction
Type & style
- Home type: SingleFamily
- Property subtype: Residential, Single Family Residence
Materials
- Roof: Composition
Condition
- Year built: 1957
Community & HOA
Location
- Region: Boron
Financial & listing details
- Price per square foot: $211/sqft
- Tax assessed value: $68,941
- Date on market: 8/30/2026
Estimated market value
$269,600
$256,000 - $283,000
$2,029/mo
Price history
| Date | Event | Price |
|---|---|---|
| 8/30/2026 | Listed for sale | $285,000+442.9%$211/sqft |
Source: TAAR #9994429 Report a problem | ||
| 2/24/2009 | Sold | $52,500-22.7%$39/sqft |
Source: Public Record Report a problem | ||
| 12/10/2008 | Listed for sale | $67,900-49.2%$50/sqft |
Source: foreclosure.com Report a problem | ||
| 8/10/2007 | Sold | $133,591+132.3%$99/sqft |
Source: Public Record Report a problem | ||
| 11/1/2002 | Sold | $57,500$43/sqft |
Source: Public Record Report a problem | ||
Public tax history
| Year | Property taxes | Tax assessment |
|---|---|---|
| 2026 | -- | $68,941 +2% |
| 2025 | $971 -0.8% | $67,590 +2% |
| 2024 | $979 +2.5% | $66,266 +2% |
| 2023 | $955 +5.1% | $64,968 +2% |
| 2022 | $909 | $63,695 +2% |
| 2021 | -- | $62,447 +1% |
| 2020 | $793 +1.5% | $61,808 |
| 2019 | $782 +1.7% | $61,808 +4% |
| 2018 | $769 +14.5% | $59,410 +18.8% |
| 2017 | $671 +19.9% | $50,000 +13.6% |
| 2016 | $560 +40.9% | $44,000 +51.7% |
| 2015 | $397 +0.2% | $29,000 |
| 2014 | $396 | $29,000 -17.1% |
| 2013 | -- | $35,000 +16.7% |
| 2012 | $407 -12.3% | $30,000 -16.1% |
| 2011 | $464 -27.6% | $35,739 -31.8% |
| 2010 | $641 -41.8% | $52,375 -48.7% |
| 2009 | $1,101 +2.3% | $102,000 +2% |
| 2008 | $1,076 +61.9% | $100,000 +60.9% |
| 2007 | $665 +2.9% | $62,152 +2% |
| 2006 | $646 +1.7% | $60,935 +2% |
| 2005 | $636 +2.1% | $59,742 |
| 2004 | $623 +41.6% | $59,742 +1.9% |
| 2003 | $440 +98.4% | $58,650 +162.1% |
| 2002 | $222 +2.1% | $22,379 +2% |
| 2001 | $217 | $21,941 |
| 2000 | -- | $21,941 |
Find assessor info on the county website
Monthly payment
Est. payment
Payment breakdown
Explore the cost of this home by adjusting the details. Changes won't be saved.Climate risks
Neighborhood: 93516

Similar homes
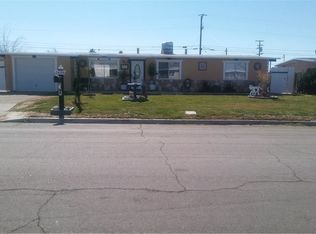
- $285,0004 bd2 ba1.3k sqft24290 Joshua Ave, Boron, CA 93516For Sale
 MLS ID #HD26217331, Stefeney DeForge, First Team Real Estate. CRMLS
- $220,0003 bd2 ba1.1k sqft24285 Sage Ave, Boron, CA 93516For Sale
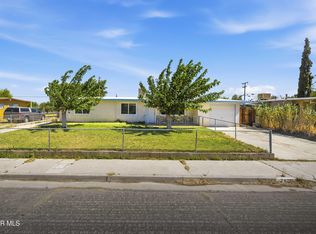 MLS ID #26004588, Mari Torres. GAVAR
- $230,0003 bd2 ba1.1k sqft12429 Sierra View St, Boron, CA 93516For Sale
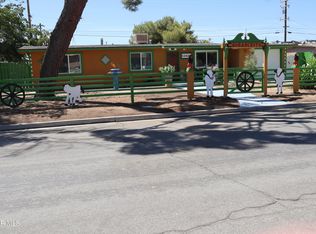 MLS ID #26006692, Edgar J Alfaro. GAVAR
- $299,0004 bd3 ba1.7k sqft12628 Daisy St, Boron, CA 93516For Sale
 MLS ID #SW26147270, Sinan Zakaria, Listed Simply. CRMLS
