Residential lot on a paved street in Plantation Estates, DeBary. City of DeBary R-4 single family zoning, no HOA and no deadline to build. Well and septic area, power at the street. New construction is selling all around it. 258 Fraser Rd one street over, built 2024, sold $368,000 in May 2025 over asking. 313 Platform Ln, built 2025, sold $381,910. 437 Belmond Dr, built 2026, sold $385,910 in six days. 328 Belmond Dr, built 2026, sold $356,965. A same size lot on Dirksen closed at $45,000 in June while other lots ask $50,000 to $85,000. Priced at the closed comp. About five minutes to the DeBary SunRail station and the new Main Street development. Note for builders, this is the Blue Spring protection area, so plan a nitrogen reducing septic system. Walk the lot any time.
Active
$44,900
246 Clara Vista St, Debary, FL 32713
--beds
0baths
9,147Square Feet
Unimproved Land, Land
Built in ----
9,147 Square Feet Lot
$-- Zestimate®
$--/sqft
$-- HOA
What's special
Paved streetPower at the street
- 125 days
- 45
- 1
Zillow last checked:
Listing updated:
Listed by:
Steven Koleno 804-656-5007,
Beycome of Florida LLC
Source: DBAMLS,MLS#: 1228290
Facts & features
Interior
Bedrooms & bathrooms
- Bathrooms: 0
Property
Lot
- Size: 9,147 Square Feet
- Dimensions: 62.0 ft x 150.0 ft
- Features: Wooded
Details
- Parcel number: 803432120280
Utilities & green energy
- Sewer: Septic Tank
- Water: Well
- Utilities for property: Cable Available, Electricity Available
Community & HOA
Community
- Subdivision: Plantation Acres
HOA
- Has HOA: No
Location
- Region: Debary
Financial & listing details
- Tax assessed value: $31,000
- Annual tax amount: $566
- Date on market: 7/6/2026
- Listing terms: Cash,Conventional,FHA,VA Loan,Other
- Electric utility on property: Yes
Estimated market value
Not available
Estimated sales range
Not available
Not available
Price history
| Date | Event | Price |
|---|---|---|
| 7/6/2026 | Listed for sale | $44,900-68% |
Source:  DBAMLS #1228290 Report a problem | ||
| 2/15/2006 | Sold | $140,300 |
Source: Agent Provided Report a problem | ||
Public tax history
| Year | Property taxes | Tax assessment |
|---|---|---|
| 2025 | $567 +3% | $31,000 +2.5% |
| 2024 | $550 +34.3% | $30,256 +53.6% |
| 2023 | $410 +15% | $19,693 +10% |
| 2022 | $356 | $17,903 +20.3% |
| 2021 | -- | $14,880 +33.3% |
| 2020 | $283 | $11,160 +80.4% |
| 2019 | $283 +35.2% | $6,186 +1.9% |
| 2018 | $209 +1.9% | $6,071 +2.1% |
| 2017 | $205 -2.2% | $5,946 +2.1% |
| 2016 | $210 +2.4% | $5,824 +0.7% |
| 2015 | $205 +31.8% | $5,784 +0.8% |
| 2014 | $156 | $5,738 -17.3% |
| 2013 | -- | $6,936 +1.7% |
| 2012 | -- | $6,820 -2.7% |
| 2011 | -- | $7,006 -42.1% |
| 2010 | -- | $12,090 -49% |
| 2009 | -- | $23,684 -40.3% |
| 2007 | -- | $39,680 +60% |
| 2006 | -- | $24,800 +150% |
| 2005 | -- | $9,920 +15.1% |
| 2004 | -- | $8,618 +20.9% |
| 2003 | -- | $7,130 |
| 2002 | -- | $7,130 |
| 2001 | -- | $7,130 |
| 2000 | -- | $7,130 |
Find assessor info on the county website
Monthly payment
Climate risks
Neighborhood: 32713

Similar homes
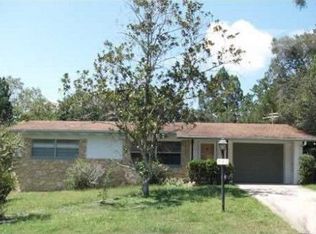
- $65,00010,559 sqft252 ACACIA ROAD LOT 20, DEBARY, FL 32713Lot/Land

 MLS ID #O6382134, Monica Rosario, AULIN PROPERTY GROUP LLC. Stellar MLS
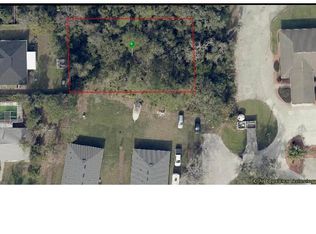
- $65,00010,642 sqft254 ACACIA ROAD LOT 19, DEBARY, FL 32713Lot/Land
 MLS ID #O6382352, Monica Rosario, AULIN PROPERTY GROUP LLC. Stellar MLS
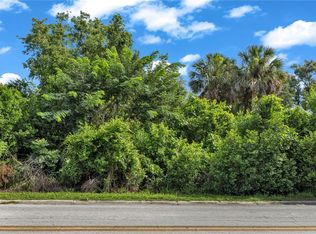
- $47,9000.31 acres132 COLOMBA ROAD LOT 8, DEBARY, FL 32713Lot/Land
 MLS ID #V4950192, Gernelle Bokuniewicz, ENRG INDIE 1 LLC. Stellar MLS
- $65,0000.63 acres88 DIRKSEN DRIVE LOT 25, DEBARY, FL 32713Lot/Land
 MLS ID #V4945327, Mike Williams, RE/MAX CENTRAL REALTY. Stellar MLS
- $45,00010,000 sqft1152 S BRICKELL DRIVE LOT 22, DELTONA, FL 32725Lot/LandMLS ID #S5160560, Adan Ordonez, ADAN INVESTMENTS REAL ESTATE GROUP, PLLC. Stellar MLS
- $29,5000.37 acres243 CLARA VISTA STREET LOT 8, DEBARY, FL 32713Lot/LandMLS ID #V4951340, Sarah Bean, COLDWELL BANKER COAST REALTY. Stellar MLS
- $65,0000.45 acres122 HOMESTEAD AVENUE LOT 14, DEBARY, FL 32713Lot/LandMLS ID #O6388541, Joe Infantino, DENOVO REALTY. Stellar MLS
- $60,0008,463 sqft53 PINEHILL ROAD LOT 14, DEBARY, FL 32713Lot/LandMLS ID #O6389375, Monica Rosario, AULIN PROPERTY GROUP LLC. Stellar MLS
- $39,00010,000 sqft1144 S BRICKELL DRIVE LOT 23, DELTONA, FL 32725Lot/LandMLS ID #S5160559, Adan Ordonez, ADAN INVESTMENTS REAL ESTATE GROUP, PLLC. Stellar MLS
- $41,5000.72 acres8011-08 N Sparkman Ave #30, Orange City, FL 32763Lot/Land
 MLS ID #2026046553, Sean Seward, Keller Williams Island Life RE. Florida Gulf Coast MLS
- $24,6500.37 acres274 TOMS ROAD LOT 21 22, DEBARY, FL 32713Lot/LandMLS ID #O6425441, Kyle Clark, RE/MAX TOWN & COUNTRY REALTY. Stellar MLS
- $39,50010,625 sqft701 RED COACH AVENUE LOT 16, DELTONA, FL 32725Lot/LandMLS ID #V4951828, Scott McGrath, BUYING PARADISE LLC. Stellar MLS
- $50,0006,098 sqftN/a E Rhode Island Ave, Orange City, FL 32763Lot/LandMLS ID #2026045604, Javier Santana, Sunland Real Estate, LLC.. Florida Gulf Coast MLS
- $55,0000.27 acres1456 EDEN DRIVE LOT 0200, DELTONA, FL 32725Lot/LandMLS ID #O6454119, Tatyana Clark, COLDWELL BANKER REALTY. Stellar MLS
- $45,9001.61 acresNELSON AVENUE LOT 197, ORANGE CITY, FL 32763Lot/LandMLS ID #V4950474, Bonnie McCleary, WATSON REALTY CORP. Stellar MLS
- $30,0000.53 acres32 FYFE AVENUE LOT 8, DEBARY, FL 32713Lot/LandMLS ID #A4697666, Cliff Glansen, FLATFEE.COM. Stellar MLS
- $37,5000.27 acres300 BOLANDER AVENUE LOT 5, DELTONA, FL 32725Lot/LandMLS ID #O6443604, Ben Sencenbaugh, THE REALTY MEDICS. Stellar MLS
- $45,0000.72 acres8011-08-30-0048 S SPARKMAN AVENUE LOT 4, ORANGE CITY, FL 32763Lot/LandMLS ID #A4706390, Sean Seward, PA, KELLER WILLIAMS ISLAND LIFE REAL ESTATE. Stellar MLS
- $43,5000.28 acres440 E Rhode Island Ave, Orange City, FL 32763Lot/Land
 MLS ID #1227730, Cliff Glansen, FlatFee.com. DBAMLS
