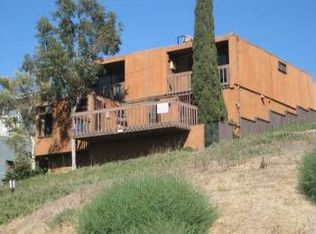
This 2378 square foot single family home has 4 bedrooms and 3.0 bathrooms. This home is located at 249 Ritchey St, San Diego, CA 92114.
Pre-foreclosure
Est. $949,100
249 Ritchey St, San Diego, CA 92114
4beds
2,378sqft
SingleFamily
Built in 1990
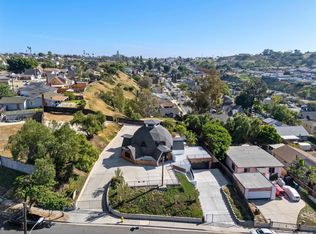
7,501 Square Feet Lot
$949,100 Zestimate®
$399/sqft
$-- HOA
Overview
- 55 days |
- 15 |
- 0 |
Facts & features
Interior
Bedrooms & bathrooms
- Bedrooms: 4
- Bathrooms: 3
- Full bathrooms: 3
Heating
- Other
Cooling
- Central
Interior area
- Total interior livable area: 2,378 sqft
Property
Parking
- Total spaces: 4
Features
- Exterior features: Wood
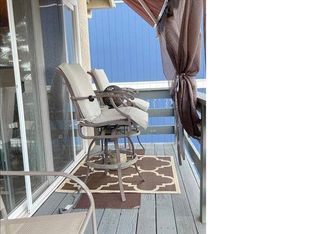
- Has view: Yes
- View description: City, Mountain
Lot
- Size: 7,501 Square Feet
Details
- Parcel number: 5492802600
Construction
Type & style
- Home type: SingleFamily
Materials
- Roof: Other
Condition
- Year built: 1990
Community & HOA
Location
- Region: San Diego
Financial & listing details
- Price per square foot: $399/sqft
- Tax assessed value: $838,353
- Annual tax amount: $11,049
Visit our professional directory to find a foreclosure specialist in your area that can help with your home search.
Find a foreclosure agentForeclosure details
Estimated market value
$949,100
$902,000 - $997,000
$3,767/mo
Price history
| Date | Event | Price |
|---|---|---|
| 10/31/2025 | Listing removed | $799,000+1.1%$336/sqft |
Source: | ||
| 12/22/2023 | Listing removed | -- |
Source: | ||
| 12/21/2021 | Sold | $790,000+0.1%$332/sqft |
Source: | ||
| 11/10/2021 | Pending sale | $788,888$332/sqft |
Source: | ||
| 11/5/2021 | Listed for sale | $788,888-1.3%$332/sqft |
Source: | ||
| 10/2/2021 | Listing removed | -- |
Source: | ||
| 8/27/2021 | Listed for sale | $799,000$336/sqft |
Source: | ||
| 8/27/2021 | Listing removed | -- |
Source: | ||
| 7/30/2021 | Listed for sale | $799,000+59.8%$336/sqft |
Source: | ||
| 8/8/2017 | Sold | $500,000+0%$210/sqft |
Source: Public Record Report a problem | ||
| 7/6/2017 | Price change | $499,950-2.9%$210/sqft |
Source: Capitis Real Estate #170025205 Report a problem | ||
| 6/7/2017 | Listed for sale | $514,950+47.1%$217/sqft |
Source: Capitis Real Estate #170025205 Report a problem | ||
| 6/5/2015 | Listing removed | $350,000$147/sqft |
Source: Realty ONE Group #150015023 Report a problem | ||
| 6/4/2015 | Listed for sale | $350,000+6.1%$147/sqft |
Source: Realty ONE Group #150015023 Report a problem | ||
| 4/2/2015 | Listing removed | $330,000$139/sqft |
Source: Keller Williams Carmel Valley/Del Mar #150015023 Report a problem | ||
| 3/28/2015 | Pending sale | $330,000$139/sqft |
Source: Keller Williams Carmel Valley/Del Mar #150015023 Report a problem | ||
| 3/22/2015 | Listed for sale | $330,000+115%$139/sqft |
Source: Keller Williams Carmel Valley/Del Mar #150015023 Report a problem | ||
| 11/14/1997 | Sold | $153,500-3.9%$65/sqft |
Source: Public Record Report a problem | ||
| 4/2/1997 | Sold | $159,710$67/sqft |
Source: Public Record Report a problem | ||
Public tax history
| Year | Property taxes | Tax assessment |
|---|---|---|
| 2025 | $11,049 +9.1% | $838,353 +2% |
| 2024 | $10,129 +2.3% | $821,916 +2% |
| 2023 | $9,905 +2.7% | $805,800 +2% |
| 2022 | $9,642 +48.4% | $790,000 +50.6% |
| 2021 | $6,497 +1.2% | $524,642 +1% |
| 2020 | $6,419 +2.3% | $519,263 +2% |
| 2019 | $6,272 +6.4% | $509,082 +2% |
| 2018 | $5,895 +143.9% | $499,100 +136.7% |
| 2017 | $2,416 +1.7% | $210,894 +2% |
| 2016 | $2,375 +1.5% | $206,760 +1.5% |
| 2015 | $2,339 +1.6% | $203,655 +2% |
| 2014 | $2,302 | $199,666 +0.5% |
| 2013 | -- | $198,765 +2% |
| 2012 | -- | $194,868 +2% |
| 2011 | -- | $191,048 +0.8% |
| 2010 | -- | $189,621 -0.2% |
| 2009 | -- | $190,073 +2% |
| 2008 | -- | $186,347 +2% |
| 2007 | -- | $182,694 +2% |
| 2006 | -- | $179,113 +2% |
| 2005 | -- | $175,602 +2% |
| 2004 | -- | $172,160 +1.9% |
| 2003 | -- | $169,006 +2% |
| 2002 | -- | $165,693 +2% |
| 2001 | -- | $162,445 |
Find assessor info on the county website
Monthly payment
Estimated monthly payment$1,822
All calculations are estimates and provided by Zillow, Inc. for informational purposes only. Actual amounts may vary.
HOA fees may include property taxes on listings classified as Co-Ops. Contact the listing agent and/or owner for fee details.
Mortgage interest rates are dependent on a number of factors, including credit score, down payment, and repayment length. Interest rate data provided by Zillow Group Marketplace, Inc. as of 1/1/1970 from various mortgage lenders with which we have lead or other similar arrangements; the Estimated Payment is an average of those rates.
See how much you could borrow to make a competitive offer.
Climate risks
Neighborhood: Skyline
Nearby schools
GreatSchools rating
- 4/10Fulton K-8Grades: K-8Distance: 0.5 mi
- 7/10Morse High SchoolGrades: 9-12Distance: 0.5 mi
- 5/10Bell Middle SchoolGrades: 6-8Distance: 1.5 mi


- California
- San Diego County
- San Diego
- 92114
- Skyline
- 249 Ritchey St
Nearby cities
Nearby neighborhoods
Nearby zip codes
Other San Diego Topics
