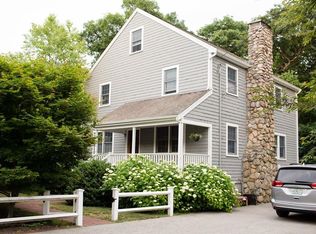
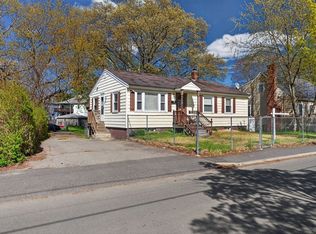
Single Story Ranch For Sale in World’s End, Hingham. Your chance to enter one of South Shore’s most desirable neighborhoods for under $1M. A new 3-Bedroom septic system was installed in Spring of 2021, septic documentation available upon request. Property is being Sold As-Is. Developers, Contractors, Flippers Take Note. Listing agent is related to sellers. Call or Text Listing agent to schedule a showing.
For sale
$780,000
25 Gilford Rd, Hingham, MA 02043
3beds
822sqft
Single Family Residence
Built in 1950
3,863 Square Feet Lot
$766,100 Zestimate®
$949/sqft
$-- HOA
What's special
- 13 days |
- 845 |
- 37 |
Zillow last checked:
Listing updated:
Listed by:
Eric Sullivan 617-866-1540,
Cameron Real Estate Group 781-486-3180,
Eric Sullivan 617-866-1540
Source: MLS PIN,MLS#: 73530536
Loading...
Facts & features
Interior
Bedrooms & bathrooms
- Bedrooms: 3
- Bathrooms: 1
- Full bathrooms: 1
Heating
- Other
Cooling
- Window Unit(s)
Features
- Has basement: No
- Number of fireplaces: 1
Interior area
- Total structure area: 822
- Total interior livable area: 822 sqft
- Finished area above ground: 822
Property
Parking
- Total spaces: 3
- Parking features: Off Street
- Uncovered spaces: 3
Features
- Waterfront features: Bay, Harbor, River
Lot
- Size: 3,863 Square Feet
- Features: Other
Details
- Parcel number: 1030610
- Zoning: Res
Construction
Type & style
- Home type: SingleFamily
- Architectural style: Ranch
- Property subtype: Single Family Residence
- Attached to another structure: Yes
Materials
- Foundation: Block
Condition
- Year built: 1950
Utilities & green energy
- Sewer: Private Sewer
- Water: Public
Community & HOA
HOA
- Has HOA: No
Location
- Region: Hingham
Financial & listing details
- Price per square foot: $949/sqft
- Tax assessed value: $999,999
- Annual tax amount: $5,227
- Date on market: 6/4/2026
Estimated market value
$766,100
$728,000 - $804,000
$2,893/mo
Price history
| Date | Event | Price |
|---|---|---|
| 6/4/2026 | Listed for sale | $780,000+160.9%$949/sqft |
Source: MLS PIN #73530536 Report a problem | ||
| 7/26/2014 | Listing removed | $299,000$364/sqft |
Source: William Raveis Real Estate #71672213 Report a problem | ||
| 4/30/2014 | Listed for sale | $299,000-4.8%$364/sqft |
Source: William Raveis R.E. & Home Services #71672213 Report a problem | ||
| 11/10/2013 | Listing removed | $314,000$382/sqft |
Source: William Raveis Real Estate #71569641 Report a problem | ||
| 8/23/2013 | Price change | $314,000-0.3%$382/sqft |
Source: William Raveis Real Estate #71569641 Report a problem | ||
| 7/28/2013 | Price change | $315,000-4.5%$383/sqft |
Source: Superior Real Estate Group, Inc. #71550084 Report a problem | ||
| 7/3/2013 | Price change | $330,000-4.3%$401/sqft |
Source: Superior Real Estate Group, Inc. #71550084 Report a problem | ||
| 3/20/2013 | Price change | $345,000-5.5%$420/sqft |
Source: Superior Real Estate Group, Inc. #71430321 Report a problem | ||
| 12/1/2012 | Listed for sale | $365,000-2.7%$444/sqft |
Source: Superior Real Estate Group, Inc. #71430321 Report a problem | ||
| 10/12/2012 | Listing removed | $375,000$456/sqft |
Source: Superior Real Estate Group, Inc. #71430321 Report a problem | ||
| 9/16/2012 | Listed for sale | $375,000+212.5%$456/sqft |
Source: Superior Real Estate Group, Inc. #71430321 Report a problem | ||
| 4/3/2012 | Sold | $120,000$146/sqft |
Source: Public Record Report a problem | ||
Public tax history
| Year | Property taxes | Tax assessment |
|---|---|---|
| 2025 | $5,227 +3.8% | $489,000 +5.4% |
| 2024 | $5,035 +9.5% | $464,100 +0.9% |
| 2023 | $4,598 +0.1% | $459,800 +15.7% |
| 2022 | $4,593 +1.1% | $397,300 +3.2% |
| 2021 | $4,541 +2.3% | $384,800 |
| 2020 | $4,437 -0.6% | $384,800 +1.8% |
| 2019 | $4,463 +4.8% | $377,900 +4.5% |
| 2018 | $4,257 +29.7% | $361,700 +35% |
| 2017 | $3,282 -4.6% | $267,900 -2.7% |
| 2016 | $3,440 +5.2% | $275,400 +5.5% |
| 2015 | $3,270 +65.2% | $261,000 +28.6% |
| 2009 | $1,979 +14.5% | $203,000 +8.1% |
| 2008 | $1,728 +1.1% | $187,800 -1.1% |
| 2007 | $1,709 -24.1% | $189,900 -22.5% |
| 2006 | $2,253 +13.2% | $244,900 +22.6% |
| 2005 | $1,990 +22.7% | $199,800 +31.5% |
| 2004 | $1,622 -6.9% | $151,900 |
| 2003 | $1,742 +10.2% | $151,900 +32.1% |
| 2001 | $1,581 +18.4% | $115,000 +35.3% |
| 1997 | $1,335 | $85,000 |
Find assessor info on the county website
Monthly payment
Est. payment$--/mo
Payment breakdown
Explore the cost of this home by adjusting the details. Changes won't be saved.All calculations are estimates and provided by Zillow, Inc. for informational purposes only. Actual amounts may vary.
HOA fees may include property taxes on listings classified as Co-Ops. Contact the listing agent and/or owner for fee details.
Mortgage interest rates are dependent on a number of factors, including credit score, down payment, and repayment length. Interest rate data provided by Zillow Group Marketplace, Inc. as of 1/1/1970 from various mortgage lenders with which we have lead or other similar arrangements; the Estimated Payment is an average of those rates.
See how much you could borrow to make a competitive offer.
Climate risks
Neighborhood: 02043
Nearby schools
GreatSchools rating
- 8/10East Elementary SchoolGrades: PK-5Distance: 1.3 mi
- 7/10Hingham Middle SchoolGrades: 6-8Distance: 5.3 mi
- 10/10Hingham High SchoolGrades: 9-12Distance: 2.1 mi
A local agent can set up tours, give advice and negotiate with sellers.
A local lender can help you make sure your offer is ready when you are.


- Massachusetts
- Plymouth County
- Hingham
- 02043
- 25 Gilford Rd
Nearby cities
Nearby zip codes
Other Hingham Topics
