AFFORDABLE LANCASTER HOME! Great for the first time homebuyers looking for their own space and the first step into generational wealth. Your once in a lifetime opportunity if you are looking to own in Lancaster without the typical Lancaster price tag.
For sale
Listed by: Keller Williams Realty Antelope Valley • Thomas Paulauskas • Contact: 661-480-6110
$329,900
2533 Topaz Ln, Lancaster, CA 93535
2beds
1,102sqft
Single Family Residence
Built in 1987
6,195 Square Feet Lot
$333,000 Zestimate®
$299/sqft
$-- HOA
What's special
- 26 days
- 1,784
- 134
Zillow last checked:
Listing updated:
Listed by:
Thomas Paulauskas DRE #01793536 661-480-6110,
Keller Williams Realty Antelope Valley
Source: CRMLS,MLS#: SR26203856 Originating MLS: California Regional MLS
Facts & features
Interior
Bedrooms & bathrooms
- Bedrooms: 2
- Bathrooms: 2
- Full bathrooms: 2
- Main level bathrooms: 1
- Main level bedrooms: 1
Rooms
- Room types: Bedroom
Bedroom
- Features: All Bedrooms Down
Heating
- Central
Cooling
- Central Air
Appliances
- Laundry: Washer Hookup
Features
- All Bedrooms Down
- Has fireplace: Yes
- Fireplace features: Living Room
- Common walls with other units/homes: No Common Walls
Interior area
- Total interior livable area: 1,102 sqft
Property
Parking
- Total spaces: 2
- Parking features: Garage - Attached
- Attached garage spaces: 2
Features
- Levels: One
- Stories: 1
- Entry location: Front
- Pool features: None
Lot
- Size: 6,195 Square Feet
- Features: 0-1 Unit/Acre
Details
- Parcel number: 3150039025
- Special conditions: Standard
Construction
Type & style
- Home type: SingleFamily
- Property subtype: Single Family Residence
Condition
- New construction: No
- Year built: 1987
Utilities & green energy
- Sewer: Public Sewer
- Water: Public
Community & HOA
Community
- Features: Curbs, Sidewalks
Location
- Region: Lancaster
Financial & listing details
- Price per square foot: $299/sqft
- Tax assessed value: $156,285
- Date on market: 9/17/2026
- Cumulative days on market: 26 days
- Listing terms: Cash,Conventional,VA Loan
Estimated market value
$333,000
$316,000 - $350,000
$2,255/mo
Price history
| Date | Event | Price |
|---|---|---|
| 10/9/2026 | Listed for sale | $329,900$299/sqft |
Source:  GAVAR #26007269 Report a problem | ||
| 10/6/2026 | Pending sale | $329,900$299/sqft |
Source: GAVAR #26007269 Report a problem | ||
| 10/2/2026 | Contingent | $329,900$299/sqft |
Source: GAVAR #26007269 Report a problem | ||
| 9/21/2026 | Listing removed | $2,295$2/sqft |
Source: Zillow Rentals Report a problem | ||
| 9/17/2026 | Listed for sale | $329,900+44.1%$299/sqft |
Source:  CRMLS #SR26203856 Report a problem | ||
| 9/11/2026 | Price change | $2,295-8.2%$2/sqft |
Source: Zillow Rentals Report a problem | ||
| 9/3/2026 | Listed for rent | $2,500+128.3%$2/sqft |
Source: Zillow Rentals Report a problem | ||
| 9/14/2016 | Listing removed | $229,000$208/sqft |
Source: Realty One Group Inc #OC16168310 Report a problem | ||
| 8/11/2016 | Pending sale | $229,000$208/sqft |
Source: Realty One Group Inc #OC16168310 Report a problem | ||
| 8/2/2016 | Listed for sale | $229,000+83.2%$208/sqft |
Source: Realty One Group Inc #OC16168310 Report a problem | ||
| 5/15/2014 | Sold | $125,000+64.2%$113/sqft |
Source: Public Record Report a problem | ||
| 4/8/2014 | Listing removed | $1,095$1/sqft |
Source: Go Section8 Report a problem | ||
| 2/3/2014 | Listed for rent | $1,095$1/sqft |
Source: Go Section8 Report a problem | ||
| 1/1/2011 | Listing removed | $76,140$69/sqft |
Source: Altisource Homes #I10129204 Report a problem | ||
| 12/26/2010 | Price change | $76,140+42.9%$69/sqft |
Source: Altisource Homes #I10129204 Report a problem | ||
| 12/18/2010 | Listed for sale | $53,298-42.7%$48/sqft |
Source: Altisource Homes #I10129204 Report a problem | ||
| 10/7/2010 | Sold | $93,000-11.4%$84/sqft |
Source: Public Record Report a problem | ||
| 5/14/2002 | Sold | $105,000+690.1%$95/sqft |
Source: Public Record Report a problem | ||
| 1/28/2002 | Sold | $13,290$12/sqft |
Source: Public Record Report a problem | ||
Public tax history
| Year | Property taxes | Tax assessment |
|---|---|---|
| 2026 | -- | $156,285 +2% |
| 2025 | $3,393 +6.1% | $153,222 +2% |
| 2024 | $3,198 +2.9% | $150,219 +2% |
| 2023 | $3,108 +4.6% | $147,274 +2% |
| 2022 | $2,970 +13.5% | $144,387 +2% |
| 2021 | $2,618 +1.2% | $141,557 +1% |
| 2020 | $2,587 | $140,106 +2% |
| 2019 | $2,587 +2.3% | $137,360 +2% |
| 2018 | $2,528 | $134,668 +2% |
| 2017 | $2,528 +1% | $132,028 +2% |
| 2016 | $2,502 +3.1% | $129,440 +1.5% |
| 2015 | $2,426 +31.5% | $127,497 +62.7% |
| 2014 | $1,844 | $78,383 +2.5% |
| 2012 | -- | $76,500 -11% |
| 2011 | -- | $86,000 +15.7% |
| 2010 | -- | $74,300 -32.6% |
| 2009 | -- | $110,200 -6.7% |
| 2008 | -- | $118,089 +2% |
| 2007 | -- | $115,774 +2% |
| 2006 | -- | $113,504 |
| 2005 | -- | $113,504 +4% |
| 2004 | -- | $109,098 +1.9% |
| 2003 | -- | $107,100 -0.4% |
| 2002 | -- | $107,527 +4% |
| 2000 | -- | $103,354 |
Find assessor info on the county website
Monthly payment
Est. payment
Payment breakdown
Explore the cost of this home by adjusting the details. Changes won't be saved.Climate risks
Neighborhood: Columbia


Similar homes
- $409,9003 bd2 ba1.2k sqft2811 La Vida Dr, Lancaster, CA 93535For Sale
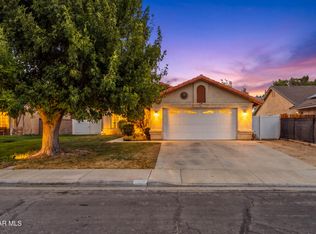 MLS ID #26008026, Christina DiMarzo. GAVAR
- $329,9004 bd2 ba1.4k sqft43847 2nd St E, Lancaster, CA 93535For Sale
 MLS ID #SR26225615, Tara Oates, HomeBased Realty. CRMLS
- $379,9003 bd2 ba1.2k sqft44117 Parkview Ln, Lancaster, CA 93535For Sale
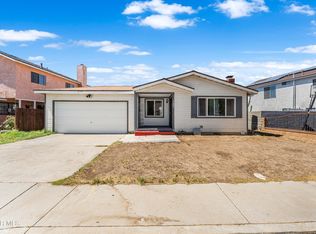 MLS ID #26007776, Rebecca Loa. GAVAR
- $375,0002 bd2 ba1.1k sqft1004 Lightcap St, Lancaster, CA 93535For Sale
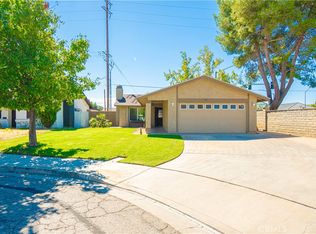 MLS ID #DW26219309, Cynthia Perez, IET Real Estate. CRMLS
