Unique opportunity in North Central Phoenix. Vacant lot zoned R-3 with utilities. The lot is 27,744 sf. flat and ready to build. This one of a kind property has horse privileges, irrigation and is in the Opportunity Zone 2.0 starting in January 2027. Plans currently available for 6 units. Waiting on final approval from the City. Reach out for details.
Lot/land
$400,000
2538 W STATE Avenue #-, Phoenix, AZ 85051
--beds
--baths
0.64Acres
Land
Built in ----
0.64 Acres Lot
$-- Zestimate®
$--/sqft
$-- HOA
What's special
- 45 days
- 77
- 0
Zillow last checked:
Listing updated:
Listed by:
Soroosh Ghafaripanah 602-332-9452,
AZ Dream Homes,
Thomas Espinosa 623-850-1593,
AZ Dream Homes
Source: ARMLS,MLS#: 7084075
Facts & features
Property
Features
- Fencing: Chain Link
Lot
- Size: 0.64 Acres
- Dimensions: 27744
Details
- Parcel number: 15731098
- Zoning: R3
Utilities & green energy
- Electric: SRP
- Sewer: Public Sewer
- Water: City Franchise
Community & HOA
Community
- Subdivision: VISTA INCOME ESTATES UNIT 5
HOA
- Has HOA: No
Location
- Region: Phoenix
Financial & listing details
- Tax assessed value: $342,400
- Annual tax amount: $1,764
- Date on market: 9/23/2026
- Cumulative days on market: 44 days
- Listing terms: Cash,Conventional
- Electric utility on property: Yes
- Road surface type: Asphalt
Estimated market value
Not available
Estimated sales range
Not available
Not available
Price history
| Date | Event | Price |
|---|---|---|
| 9/23/2026 | Listed for sale | $400,000+370.6% |
Source:  ARMLS #7084075 Report a problem | ||
| 4/5/2016 | Sold | $85,000+30.8% |
Source: Public Record Report a problem | ||
| 9/30/1998 | Sold | $65,000 |
Source: Public Record Report a problem | ||
Public tax history
| Year | Property taxes | Tax assessment |
|---|---|---|
| 2025 | $1,739 +3.9% | $51,360 +10.1% |
| 2024 | $1,674 +1.8% | $46,665 +270.5% |
| 2023 | $1,645 +2% | $12,594 -35.6% |
| 2022 | $1,613 +1.3% | $19,560 +13.7% |
| 2021 | $1,593 +1.9% | $17,205 -8.3% |
| 2020 | $1,564 +2.7% | $18,765 +52.2% |
| 2019 | $1,523 | $12,330 +106.2% |
| 2018 | $1,523 +135.5% | $5,980 -1.6% |
| 2017 | $647 +24.5% | $6,080 +11.4% |
| 2016 | $519 -2.2% | $5,460 +0.9% |
| 2015 | $531 | $5,410 +28.8% |
| 2014 | -- | $4,200 +33.3% |
| 2013 | -- | $3,150 |
| 2012 | -- | $3,150 -46.2% |
| 2011 | -- | $5,850 -31% |
| 2010 | -- | $8,480 -37.5% |
| 2009 | -- | $13,560 -11.4% |
| 2008 | -- | $15,300 +20.9% |
| 2007 | -- | $12,650 +38.3% |
| 2006 | -- | $9,150 |
| 2005 | -- | $9,150 +18.8% |
| 2004 | -- | $7,700 |
| 2003 | -- | $7,700 +45.3% |
| 2002 | -- | $5,300 |
Find assessor info on the county website
Monthly payment
Climate risks
Neighborhood: Alhambra


Similar homes
- $395,0000.56 acres5020 N 21st Avenue #7, Phoenix, AZ 85015Lot/Land
 MLS ID #7077641, Gunnar Sinnett, Levrose Real Estate. ARMLS
- $370,0007,789 sqft2647 W MARSHALL Avenue #40, Phoenix, AZ 85017Lot/Land
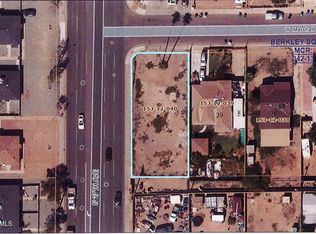 MLS ID #7092152, Eve R Treger, Vicsdale. ARMLS
- $399,0000.35 acres1201 E Desert Park Lane #1 and 2, Phoenix, AZ 85020Lot/Land
 MLS ID #7067985, Craig A Young, Real Broker. ARMLS
- $449,0001.76 acres1108 W DESERT COVE Avenue #-, Phoenix, AZ 85029Lot/Land
 MLS ID #7095274, Karen A. Ingersoll, Keller Williams Arizona Realty. ARMLS
