This rehab-ready duplex is primed to add income to your rental portfolio. Ideal East End location, perfectly centered between Tusculum, Hyde Park, & Mt. Adams. Currently arranged as a 2/2 upper unit and a 1/1 lower but could be reimagined as a tri-plex - all with separate meters & access. Get a jump-start on renovations with much of the demo and initial framing already completed. Outdoor deck and partially fenced yard is an added bonus
For sale
$155,000
2550 Riverside Dr, Cincinnati, OH 45202
3beds
--baths
2,124sqft
Multi Family, Duplex
Built in 1894
-- sqft lot
$-- Zestimate®
$73/sqft
$-- HOA
What's special
Partially fenced yardOutdoor deck
- 20 hours
- 74
- 7
Zillow last checked:
Listing updated:
Listed by:
Ryan Harvey 859-640-2106,
Wyndham-Lyons Realty Services, 513-322-2905
Source: Cincy MLS,MLS#: 1898344 Originating MLS: Cincinnati Area Multiple Listing Service
Facts & features
Interior
Bedrooms & bathrooms
- Bedrooms: 3
Heating
- Electric
Cooling
- Central Air
Features
- Windows: Aluminum Frames
- Basement: Full
- Number of fireplaces: 2
- Fireplace features: Brick, Inoperable
Interior area
- Total structure area: 2,124
- Total interior livable area: 2,124 sqft
Property
Parking
- Parking features: On Street
- Has uncovered spaces: Yes
Features
- Stories: 3
Lot
- Size: 2,003 Square Feet
Details
- Parcel number: 0310005004500
Construction
Type & style
- Home type: MultiFamily
- Property subtype: Multi Family, Duplex
Materials
- Vinyl Siding
- Foundation: Stone
- Roof: Shingle
Condition
- New construction: No
- Year built: 1894
Utilities & green energy
- Gas: None
- Sewer: Public Sewer
- Water: Public
Community & HOA
Location
- Region: Cincinnati
Financial & listing details
- Price per square foot: $73/sqft
- Annual tax amount: $2,750
- Date on market: 10/27/2026
- Listing terms: No Special Financing
Estimated market value
Not available
Estimated sales range
Not available
Not available
Price history
| Date | Event | Price |
|---|---|---|
| 10/27/2026 | Listed for sale | $155,000+19.2%$73/sqft |
Source:  Cincy MLS #1898344 Report a problem | ||
| 11/9/2022 | Sold | $130,000$61/sqft |
Source: Cincy MLS #1753660 Report a problem | ||
| 9/26/2022 | Pending sale | $130,000$61/sqft |
Source: Cincy MLS #1753660 Report a problem | ||
| 9/21/2022 | Listed for sale | $130,000-7.1%$61/sqft |
Source: Cincy MLS #1753660 Report a problem | ||
| 8/10/2022 | Listing removed | -- |
Source: Cincy MLS #1738991 Report a problem | ||
| 7/8/2022 | Price change | $140,000-11.9%$66/sqft |
Source: Cincy MLS #1738991 Report a problem | ||
| 6/25/2022 | Price change | $159,000-6.5%$75/sqft |
Source: Cincy MLS #1738991 Report a problem | ||
| 5/20/2022 | Price change | $170,000-8.1%$80/sqft |
Source: Cincy MLS #1738991 Report a problem | ||
| 5/14/2022 | Listed for sale | $185,000$87/sqft |
Source: Cincy MLS #1738991 Report a problem | ||
Public tax history
| Year | Property taxes | Tax assessment |
|---|---|---|
| 2025 | $2,847 +1.7% | $45,500 |
| 2024 | $2,798 -1.3% | $45,500 |
| 2023 | $2,834 +62.5% | -- |
| 2022 | $1,745 +1.3% | $25,092 |
| 2021 | $1,722 | $25,092 |
| 2020 | $1,722 -5.7% | $25,092 +14% |
| 2019 | $1,826 +15.6% | $22,008 |
| 2018 | $1,580 | $22,008 |
| 2017 | $1,580 +51.7% | $22,008 +38.7% |
| 2016 | $1,041 | $15,870 |
| 2015 | $1,041 -0.6% | $15,870 |
| 2014 | $1,048 +0.2% | $15,870 +2% |
| 2013 | $1,046 +2% | $15,558 |
| 2012 | $1,026 +2.5% | $15,558 |
| 2011 | $1,001 -9.5% | $15,558 -15.5% |
| 2010 | $1,106 +2.9% | $18,421 |
| 2009 | $1,075 +1.7% | $18,421 |
| 2008 | $1,057 +16.5% | $18,421 +2% |
| 2007 | $907 -3.7% | $18,060 |
| 2006 | $942 +4% | $18,060 |
| 2005 | $906 +48.6% | $18,060 +62.8% |
| 2003 | $610 +6.7% | $11,095 |
| 2002 | $572 +2.1% | $11,095 +6.7% |
| 2001 | $560 +3.5% | $10,395 |
| 2000 | $541 | $10,395 |
Find assessor info on the county website
Monthly payment
Est. payment
Payment breakdown
Explore the cost of this home by adjusting the details. Changes won't be saved.Climate risks
Neighborhood: East End


Similar homes
- $180,0004 bd2 ba2.8k sqft3531 Hudson Ave, Cincinnati, OH 45207For Sale

 MLS ID #1898566, Sylvia Nelson, Comey & Shepherd. Cincy MLS
- $150,0004 bd1 ba1k sqft2326 Gladstone Ave, Cincinnati, OH 45202For Sale
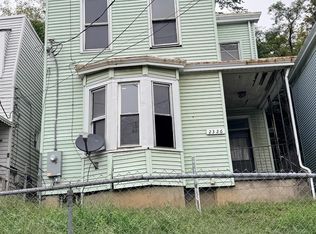 MLS ID #1896124, Kea D Frazier, Coldwell Banker Realty. Cincy MLS
- $140,0003 bd3 ba1.2k sqft38 E Clifton Ave, Cincinnati, OH 45202For Sale
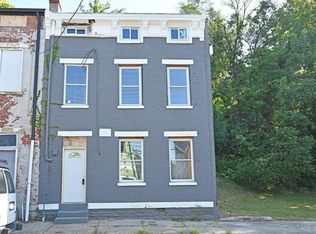 MLS ID #1892818, Sylvia Nelson, Comey & Shepherd. Cincy MLS
- $145,0003 bd2 ba1.5k sqft34 W 13th St, Newport, KY 41071For Sale
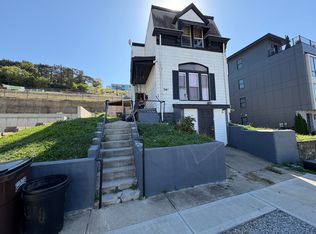 MLS ID #647843, Kyle Claxton, Haven Homes Group. NKMLS
- $140,0003 bd2 ba1.6k sqft1626 Brewster Ave, Cincinnati, OH 45207For SaleMLS ID #1885351, M. Doug Spitz, Coldwell Banker Realty. Cincy MLS
- $144,9003 bd2 ba1.3k sqft3238 Gilbert Ave, Cincinnati, OH 45207For SaleMLS ID #1890824, Sami K. Kassem, ERA REAL Solutions Realty. LLC. Cincy MLS
- $154,9006 bd-- ba2.8k sqft1602 John St, Cincinnati, OH 45214For SaleMLS ID #1884129, Troy Kutcha, Plum Tree Realty. Cincy MLS
- $220,0002 bd2 ba1.4k sqft2734 Hoff Ave, Cincinnati, OH 45202For SaleMLS ID #1779536, Quennie F Jones, Coldwell Banker Realty. Cincy MLS
- $175,0002 bd3 ba1.2k sqft2324 Madison Rd APT 1509, Cincinnati, OH 45208For SaleMLS ID #1886345, Steve S Early, Sibcy Cline, Inc.. Cincy MLS
- $120,0003 bd-- ba1.7k sqft4925 Paddock Rd, Cincinnati, OH 45237For SaleMLS ID #1897526, Terri E. Davis, Keller Williams Advisors. Cincy MLS
- $229,9004 bd3 ba1.8k sqft134 Delmar Ave, Cincinnati, OH 45217For SaleMLS ID #1898131, Conner Seither, Reinvest Consultants, LLC. Cincy MLS
- $140,0003 bd1 ba1.1k sqft1616 Brewster Ave, Cincinnati, OH 45207For SaleMLS ID #1885363, M. Doug Spitz, Coldwell Banker Realty. Cincy MLS
- $160,0003 bd2 ba1.4k sqft1839 Hewitt Ave, Cincinnati, OH 45207For SaleMLS ID #1871989, Martin A. Rutland, Bee Hive Realty I & D, LLC. Cincy MLS
- $185,0003 bd1 ba1.7k sqft3519 Wabash Ave, Cincinnati, OH 45207For SaleMLS ID #1892408, Sami K. Kassem, ERA REAL Solutions Realty. LLC. Cincy MLS
- $165,0003 bd3 ba3.1k sqft409 Whiteman St, Cincinnati, OH 45214For SaleMLS ID #1889715, Harold B Drummer II, www.WEBMLS.net. Cincy MLS
- $140,0003 bd1 ba1.5k sqft3549 Idlewild Ave, Cincinnati, OH 45207For SaleMLS ID #1879603, Anthony Brown, SA Brown Realty, LLC. Cincy MLS
- $165,0002 bd2 ba1.3k sqft2100 Fulton Ave Unit A1, Cincinnati, OH 45206For SaleMLS ID #1882462, Thomas F Williams Jr, Keller Williams Seven Hills Re. Cincy MLS
- $169,9002 bd2 ba1.4k sqft4620 Carter Ave, Cincinnati, OH 45212For SaleMLS ID #1895752, Brian J Jackson, Keller Williams Seven Hills Re. Cincy MLS
