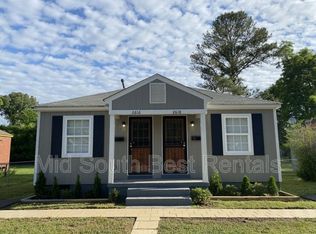
This great brick investment, 2-bedroom 2 bath duplex will not last long. Each side is 1bed 1bath. This is fully occupied. Please do not disturb tenants. Inspection with accepted contract. Please submit offer subject to viewing. Units might vacant so check with listing agent. All offers must have proof of funds or bank letter. EM to be held by listing agents closing attorney.
For sale
$105,000
2606 Deadrick Ave, Memphis, TN 38114
2beds
919sqft
Duplex
Built in 1970
-- sqft lot
$-- Zestimate®
$114/sqft
$-- HOA
What's special
- 35 days
- 73
- 4
Zillow last checked:
Listing updated:
Listed by:
Micah Layman,
Ware Jones, REALTORS 901-450-4011
Source: MAAR,MLS#: 10230418
Facts & features
Interior
Bedrooms & bathrooms
- Bedrooms: 2
- Bathrooms: 2
- Full bathrooms: 2
Heating
- Other (See Remarks)
Cooling
- Other (See Remarks)
Features
- Separate Den, Square Feet Source:AutoFill (MAARdata) or Public Records (Cnty Assessor Site)
- Windows: Window Treatments
Interior area
- Total interior livable area: 919 sqft
Property
Parking
- Parking features: Driveway/Pad
- Has uncovered spaces: Yes
Features
- Stories: 1
- Pool features: None
Lot
- Size: 5,750 Square Feet
- Dimensions: 50 x 115
- Features: Landscaped
Details
- Parcel number: 061020 00023
Construction
Type & style
- Home type: MultiFamily
- Architectural style: Traditional
- Property subtype: Duplex
Materials
- Brick Veneer
Condition
- Year built: 1970
Community & HOA
Community
- Subdivision: Goff & Alper
Location
- Region: Memphis
Financial & listing details
- Price per square foot: $114/sqft
- Tax assessed value: $50,300
- Annual tax amount: $1,060
- Date on market: 9/14/2026
- Listing terms: Conventional,Other (See Remarks)
- Lease term: Month To Month
- Total actual rent: 1150
Estimated market value
Not available
Estimated sales range
Not available
$814/mo
Price history
| Date | Event | Price |
|---|---|---|
| 9/14/2026 | Listed for sale | $105,000+20.7%$114/sqft |
Source:  MAAR #10230418 Report a problem | ||
| 9/10/2025 | Sold | $87,000-17.1%$95/sqft |
Source:  RealTracs MLS as distributed by MLS GRID #3084130 Report a problem | ||
| 7/30/2025 | Pending sale | $105,000$114/sqft |
Source: MAAR #10199670 Report a problem | ||
| 6/23/2025 | Listed for sale | $105,000+393%$114/sqft |
Source: MAAR #10199670 Report a problem | ||
| 9/6/2022 | Sold | $21,300-66.2%$23/sqft |
Source: Public Record Report a problem | ||
| 2/28/2022 | Sold | $63,000$69/sqft |
Source: RealTracs MLS as distributed by MLS GRID #3086967 Report a problem | ||
| 2/14/2022 | Pending sale | $63,000$69/sqft |
Source: MAAR #10117414 Report a problem | ||
| 2/12/2022 | Listed for sale | $63,000+18.9%$69/sqft |
Source: MAAR #10117414 Report a problem | ||
| 8/11/2021 | Sold | $53,000+39.5%$58/sqft |
Source: Public Record Report a problem | ||
| 9/17/2012 | Listing removed | $38,000$41/sqft |
Source: Crye-Leike #3242602 Report a problem | ||
| 6/14/2012 | Price change | $38,000-8.4%$41/sqft |
Source: Crye-Leike #3242602 Report a problem | ||
| 3/14/2012 | Listed for sale | $41,500+492%$45/sqft |
Source: Crye-Leike #3242602 Report a problem | ||
| 10/13/1994 | Sold | $7,010$8/sqft |
Source: Public Record Report a problem | ||
Public tax history
| Year | Property taxes | Tax assessment |
|---|---|---|
| 2025 | $1,060 +89% | $20,120 +136.2% |
| 2024 | $561 +8.1% | $8,520 |
| 2023 | $519 | $8,520 |
| 2022 | -- | $8,520 |
| 2021 | -- | $8,520 -13.4% |
| 2020 | $314 | $9,840 |
| 2019 | $314 -21.1% | $9,840 |
| 2018 | $399 -45.1% | $9,840 |
| 2017 | $726 +100% | $9,840 -7.9% |
| 2016 | $363 +255.9% | $10,680 |
| 2014 | $102 | $10,680 |
| 2013 | -- | $10,680 +9.9% |
| 2012 | -- | $9,720 |
| 2011 | -- | -- |
| 2010 | -- | $9,720 |
| 2009 | -- | $9,720 -12.3% |
| 2008 | -- | $11,080 |
| 2007 | -- | $11,080 |
| 2006 | -- | $11,080 |
| 2005 | -- | $11,080 +13.5% |
| 2004 | -- | $9,760 |
| 2003 | -- | $9,760 +50.6% |
| 2002 | -- | $6,480 -33.6% |
| 2001 | -- | $9,760 +6.1% |
| 2000 | -- | $9,200 |
Find assessor info on the county website
Monthly payment
Est. payment
Payment breakdown
Explore the cost of this home by adjusting the details. Changes won't be saved.Climate risks
Neighborhood: Colonial-Yorkshire

Similar homes
- $99,9003 bd1 ba918 sqft2877 Brewer Ave, Memphis, TN 38114For Sale
 MLS ID #10227789, Dean Harris, CrestCore Realty MphsBrokerage. MAAR
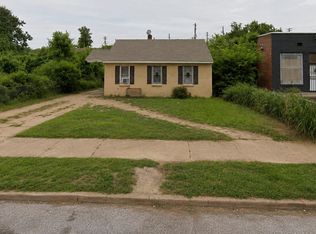
- $115,0002 bd1 ba918 sqft2022 Boyle Ave, Memphis, TN 38114For Sale
 MLS ID #10227586, Leaser A Coleman, Empire Realty, LLC. MAAR
- $129,0002 bd2 ba1.2k sqft770 Brower St, Memphis, TN 38111For Sale
 MLS ID #10230150, Andrew Akins, CB Properties of Memphis, LLC. MAAR
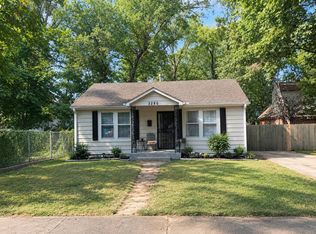
- $95,5002 bd1 ba806 sqft3280 Carrington Rd, Memphis, TN 38111For Sale
 MLS ID #10230086, Donnie K Morrow, eXp Realty, LLC. MAAR
- $95,0002 bd1 ba919 sqft1794 McMillan St, Memphis, TN 38106For Sale
 MLS ID #3224828, Jennifer Carstensen. RealTracs MLS as distributed by MLS GRID
