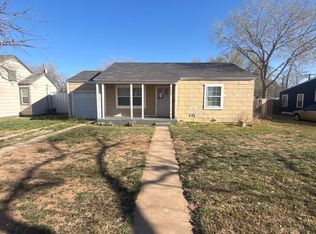
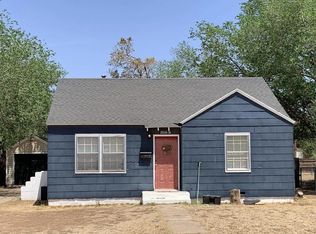
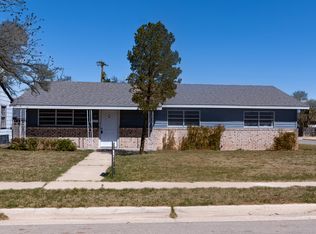
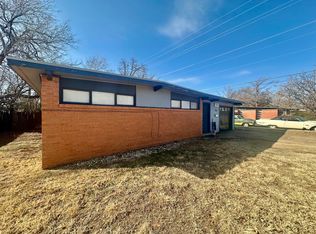
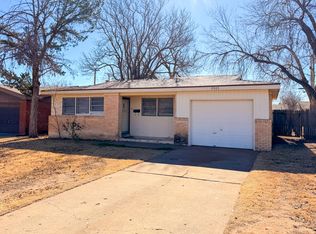
Investment opportunity near Texas Tech University, Medical District, restaurants, shopping and more. 3 bed, 2 bath offering a spacious kitchen area, large isolated master, and hardwood flooring throughout. A large driveway, detached garage, and big back yard with high fencing. Currently leased through January 2027. Schedule your showing today!
Pending
$145,000
2610 36th St, Lubbock, TX 79413
3beds
1,208sqft
Single Family Residence, Residential
Built in 1952
7,405 Square Feet Lot
$141,600 Zestimate®
$120/sqft
$-- HOA
What's special
Detached garageHardwood flooring throughoutLarge isolated masterSpacious kitchen areaLarge driveway
- 47 days |
- 24 |
- 0 |
Likely to sell faster than
Zillow last checked:
Listing updated:
Listed by:
Mackenzie Siler TREC #0807776 806-781-2062,
ERA Newlin & Company
Source: LBMLS,MLS#: 202606394
Facts & features
Interior
Bedrooms & bathrooms
- Bedrooms: 3
- Bathrooms: 2
- Full bathrooms: 2
Heating
- Central, Electric
Cooling
- Central Air, Electric
Features
- Ceiling Fan(s), Granite Counters
- Has basement: No
- Has fireplace: No
Interior area
- Total structure area: 1,208
- Total interior livable area: 1,208 sqft
- Finished area above ground: 1,208
Property
Parking
- Parking features: Off Street
Features
- Exterior features: None
- Fencing: Fenced
Lot
- Size: 7,405 Square Feet
Details
- Parcel number: R122796
Construction
Type & style
- Home type: SingleFamily
- Property subtype: Single Family Residence, Residential
Materials
- Metal Siding, Vinyl Siding
- Foundation: Slab
- Roof: Composition
Condition
- New construction: No
- Year built: 1952
Utilities & green energy
- Water: Public
Community & HOA
Community
- Security: Carbon Monoxide Detector(s), Smoke Detector(s)
Location
- Region: Lubbock
Financial & listing details
- Price per square foot: $120/sqft
- Tax assessed value: $115,614
- Annual tax amount: $2,046
- Date on market: 5/13/2026
- Cumulative days on market: 12 days
- Listing terms: Cash,Conventional,FHA
- Road surface type: Paved
Estimated market value
$141,600
$135,000 - $149,000
$1,401/mo
Price history
| Date | Event | Price |
|---|---|---|
| 5/26/2026 | Pending sale | $145,000$120/sqft |
Source: | ||
| 5/13/2026 | Listed for sale | $145,000-7.9%$120/sqft |
Source: | ||
| 2/5/2026 | Listing removed | $1,280$1/sqft |
Source: Zillow Rentals Report a problem | ||
| 1/12/2026 | Listed for rent | $1,280+2.4%$1/sqft |
Source: Zillow Rentals Report a problem | ||
| 7/28/2025 | Listing removed | $157,500$130/sqft |
Source: | ||
| 7/8/2025 | Listed for sale | $157,500+5%$130/sqft |
Source: | ||
| 10/17/2023 | Listing removed | -- |
Source: Zillow Rentals Report a problem | ||
| 9/21/2023 | Listed for rent | $1,250$1/sqft |
Source: Zillow Rentals Report a problem | ||
| 1/26/2023 | Listing removed | -- |
Source: | ||
| 12/27/2022 | Pending sale | $150,000$124/sqft |
Source: | ||
| 12/15/2022 | Listed for sale | $150,000+16.3%$124/sqft |
Source: | ||
| 3/24/2021 | Listing removed | -- |
Source: Owner Report a problem | ||
| 9/26/2017 | Listing removed | $129,000$107/sqft |
Source: Owner Report a problem | ||
| 9/23/2017 | Listed for sale | $129,000+61.5%$107/sqft |
Source: Owner Report a problem | ||
| 6/22/2017 | Listing removed | $79,900$66/sqft |
Source: Martin, REALTORS #201703788 Report a problem | ||
| 6/19/2017 | Price change | $79,900-5.9%$66/sqft |
Source: Martin, REALTORS #201703788 Report a problem | ||
| 6/6/2017 | Price change | $84,900-5.6%$70/sqft |
Source: Martin, REALTORS #201703788 Report a problem | ||
| 5/23/2017 | Listed for sale | $89,900$74/sqft |
Source: Martin, REALTORS #201703788 Report a problem | ||
Public tax history
| Year | Property taxes | Tax assessment |
|---|---|---|
| 2025 | $2,046 -5.3% | $115,614 -2.8% |
| 2024 | $2,159 -0.3% | $118,897 +2% |
| 2023 | $2,166 +11.1% | $116,529 +21% |
| 2022 | $1,949 +20.4% | $96,284 +26.5% |
| 2021 | $1,619 -0.7% | $76,137 |
| 2020 | $1,631 +1.1% | $76,137 +2.7% |
| 2019 | $1,612 +3% | $74,148 +4.2% |
| 2018 | $1,566 | $71,163 +2.1% |
| 2017 | $1,566 +21.5% | $69,671 +14% |
| 2016 | $1,289 | $61,104 +5.4% |
| 2015 | $1,289 | $57,956 |
| 2014 | $1,289 | $57,956 |
| 2013 | -- | $57,956 |
| 2012 | -- | $57,956 |
| 2011 | -- | $57,956 |
| 2010 | -- | $57,956 |
| 2009 | -- | $57,956 +5.8% |
| 2008 | -- | $54,799 +1.6% |
| 2007 | -- | $53,953 +10% |
| 2006 | -- | $49,048 -2.8% |
| 2005 | -- | $50,458 +8.5% |
| 2004 | -- | $46,504 +10% |
| 2003 | -- | $42,276 +2.5% |
| 2002 | $1,022 +69.5% | $41,234 +20.9% |
| 2001 | $603 +0.6% | $34,097 |
| 2000 | $599 | $34,097 |
Find assessor info on the county website
Monthly payment
Est. payment$--/mo
Payment breakdown
Explore the cost of this home by adjusting the details. Changes won't be saved.All calculations are estimates and provided by Zillow, Inc. for informational purposes only. Actual amounts may vary.
HOA fees may include property taxes on listings classified as Co-Ops. Contact the listing agent and/or owner for fee details.
Mortgage interest rates are dependent on a number of factors, including credit score, down payment, and repayment length. Interest rate data provided by Zillow Group Marketplace, Inc. as of 1/1/1970 from various mortgage lenders with which we have lead or other similar arrangements; the Estimated Payment is an average of those rates.
See how much you could borrow to make a competitive offer.
Climate risks
Neighborhood: Wheelock & Monterey
Nearby schools
GreatSchools rating
- 4/10Wheelock Elementary SchoolGrades: PK-5Distance: 0.5 mi
- 2/10Slaton Middle SchoolGrades: 6-8Distance: 1.2 mi
- 5/10Monterey High SchoolGrades: 9-12Distance: 1 mi


A local agent can set up tours, give advice and negotiate with sellers.

Nearby cities
Nearby neighborhoods
Nearby zip codes
Other Lubbock Topics
