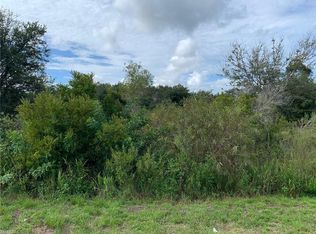
Build your future on this quarter-acre residential lot in the growing community of Lehigh Acres! This property offers a great opportunity to build your dream home or invest in Southwest Florida real estate. Situated on a paved street with newer homes nearby and no HOA restrictions, this lot provides flexibility for your future plans. Enjoy convenient access to shopping, dining, schools, and major roadways connecting you to Fort Myers and the Gulf Coast. Whether you're a builder, investor, or future homeowner, this affordable property is an opportunity to secure your piece of Southwest Florida!
Lot/land
Price cut: $1K (11/18)
$17,800
2613 48TH Street SW, Lehigh Acres, FL 33976
--beds
--baths
0.25Acres
Unimproved Land
Built in ----
0.25 Acres Lot
$-- Zestimate®
$--/sqft
$-- HOA
What's special
Newer homes nearbyQuarter-acre residential lot
- 13 days
- 110
- 5
Zillow last checked:
Listing updated:
Listed by:
Michelle Stern 772-480-5534,
Century 21 Move with Us
Source: BeachesMLS,MLS#: B26097536 Originating MLS: BeachesMLS
Facts & features
Interior
Video & virtual tour
Property
Lot
- Size: 0.25 Acres
- Features: 1/4 to 1/2 Acre Lot
Details
- Parcel number: 134526l2040380040
- Zoning: RS-1
- Special conditions: Standard
Utilities & green energy
- Water: Well
- Utilities for property: Cable Available, Electricity Available, Water Available
Community & HOA
Community
- Subdivision: Lehigh Acres
HOA
- Has HOA: No
Location
- Region: Lehigh Acres
Financial & listing details
- Tax assessed value: $10,495
- Annual tax amount: $413
- Date on market: 11/7/2026
- Cumulative days on market: 14 days
- Listing terms: Cash
- Electric utility on property: Yes
- Road surface type: Paved
Estimated market value
Not available
Estimated sales range
Not available
Not available
Price history
| Date | Event | Price |
|---|---|---|
| 11/18/2026 | Price change | $17,800-5.3% |
Source:  BeachesMLS #B26097536 Report a problem | ||
| 11/7/2026 | Listed for sale | $18,800-10.5% |
Source: BeachesMLS #B26097536 Report a problem | ||
| 10/20/2026 | Listing removed | $21,000 |
Source: BeachesMLS #B26018096 Report a problem | ||
| 8/26/2026 | Price change | $21,000-14.3% |
Source: BeachesMLS #B26018096 Report a problem | ||
| 8/17/2026 | Price change | $24,500-2% |
Source: BeachesMLS #B26018096 Report a problem | ||
| 8/3/2026 | Price change | $25,000-16.7% |
Source: BeachesMLS #B26018096 Report a problem | ||
| 4/21/2026 | Listed for sale | $30,000+172.7% |
Source: BeachesMLS #B26018096 Report a problem | ||
| 1/31/2022 | Sold | $11,000 |
Source:  Florida Gulf Coast MLS #222001278 Report a problem | ||
| 1/7/2022 | Pending sale | $11,000 |
Source:  Florida Gulf Coast MLS #222001278 Report a problem | ||
| 1/6/2022 | Listed for sale | $11,000 |
Source: Florida Gulf Coast MLS #222001278 Report a problem | ||
Public tax history
| Year | Property taxes | Tax assessment |
|---|---|---|
| 2025 | $498 +10.2% | $18,381 +10% |
| 2024 | $452 +9.9% | $16,710 +10% |
| 2023 | $412 +21.9% | $15,191 +50% |
| 2022 | $338 +22.7% | $10,128 +109.5% |
| 2021 | $275 +2.6% | $4,835 +10% |
| 2020 | $268 +122.5% | $4,395 -6.5% |
| 2019 | $120 | $4,700 +6.8% |
| 2018 | $120 +11.3% | $4,400 +9% |
| 2017 | $108 +6.3% | $4,038 +6.3% |
| 2016 | $102 +7.6% | $3,800 +13.1% |
| 2015 | $95 +5.1% | $3,360 +23.8% |
| 2014 | $90 +26.6% | $2,715 +0.6% |
| 2013 | $71 +15.8% | $2,700 +31.7% |
| 2012 | $61 -7.4% | $2,050 -10.9% |
| 2011 | $66 -1.1% | $2,300 |
| 2010 | $67 -9% | $2,300 -17.9% |
| 2009 | $74 -57.8% | $2,800 -70.8% |
| 2008 | $175 -51.9% | $9,600 -54.9% |
| 2007 | $363 -48.6% | $21,300 -49.2% |
| 2006 | $706 +730.8% | $41,920 +1132.9% |
| 2004 | $85 +77% | $3,400 +161.5% |
| 2003 | $48 +12.4% | $1,300 +30% |
| 2002 | $43 | $1,000 +17.6% |
| 2000 | -- | $850 |
Find assessor info on the county website
Monthly payment
Climate risks
Neighborhood: 33976
Similar homes
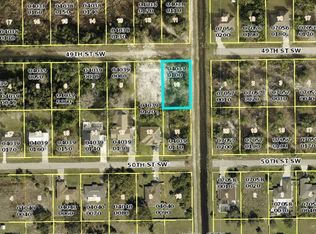
- $19,00010,454 sqft2601 49th St SW, Lehigh Acres, FL 33976Lot/Land
 MLS ID #225041387, Mike Darda, Compass Florida LLC. Florida Gulf Coast MLS
- $20,0000.25 acres2712 54th ST SW, LEHIGH ACRES, FL 33976Lot/Land

 MLS ID #226036083, Gabriel Penton, Invest Ready Realty. SWFLMLS
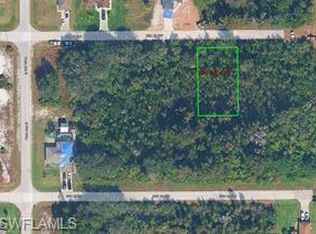
- $18,5000.25 acres2705 35th ST SW, LEHIGH ACRES, FL 33976Lot/Land
 MLS ID #226027805, Angel Herrero Fuentes, Xclusive Homes LLC. SWFLMLS
- $19,0000.25 acres2704 36th St SW, Lehigh Acres, FL 33976Lot/Land
 MLS ID #2026037129, Jorge Diego Menendez Ponce, Mamba Realty LLC. Florida Gulf Coast MLS
- $24,9990.25 acres2608 53rd St SW, Lehigh Acres, FL 33976Lot/LandMLS ID #2026009317, Julissa Chacon, Dominex Realty Group LLC. Florida Gulf Coast MLS
- $19,0000.26 acres2802 21st St SW, Lehigh Acres, FL 33976Lot/LandMLS ID #2026034960, Sonia Rios, Sonia Rios Realty. Florida Gulf Coast MLS
- $19,0000.25 acres2802 20th St SW, Lehigh Acres, FL 33976Lot/LandMLS ID #2026034959, Sonia Rios, Sonia Rios Realty. Florida Gulf Coast MLS
- $18,0000.25 acres3416 38th ST SW, LEHIGH ACRES, FL 33976Lot/LandMLS ID #226016542, Angela Hernandez Perez, Marzucco Real Estate. SWFLMLS
- $24,9000.25 acres3004 44th St SW, Lehigh Acres, FL 33976Lot/LandMLS ID #2026042506, Saulius Bruzas, Florida Signature Realty Inc. Florida Gulf Coast MLS
- $22,0000.25 acres3817 38th ST SW, LEHIGH ACRES, FL 33976Lot/LandMLS ID #226039757, Gabriel Penton, Invest Ready Realty. SWFLMLS
- $25,0000.25 acres625 Tomasello Dr, Lehigh Acres, FL 33974Lot/LandMLS ID #2026048843, Jam Bryson, Century 21 Selling Paradise. Florida Gulf Coast MLS
- $24,5008,337 sqft808 Coral Ave, Lehigh Acres, FL 33936Lot/LandMLS ID #2026048809, Esperencia Cadet Romain, Coldwell Banker Preferred Properties. Florida Gulf Coast MLS
- $25,5000.25 acres2609 32nd St SW, Lehigh Acres, FL 33976Lot/LandMLS ID #2026024894, Bonney Leckie, Century 21 Selling Paradise. Florida Gulf Coast MLS
- $26,0000.25 acresLee County Unincorporated, Lehigh Acres, FL 33976Lot/Land
 MLS ID #A12099407, Azahira Guillen-Borrego, Guillen & Associates. MIAMI
- $14,0000.25 acres2812 20th St SW, Lehigh Acres, FL 33976Lot/LandMLS ID #2025009866, Sonia Rios, Sonia Rios Realty. Florida Gulf Coast MLS
- $26,50010,001 sqft616 KINGSBURY STREET E LOT 5, LEHIGH ACRES, FL 33974Lot/Land
 MLS ID #TB8569232, Clarence Fields, FIELDS OF PROSPER LLC. Stellar MLS
- $25,0000.25 acres3401 38th ST SW, LEHIGH ACRES, FL 33976Lot/LandMLS ID #226032975, Clara Rojas, A Plus Realty. SWFLMLS
- $23,9000.29 acres515 Empire Ave S, Lehigh Acres, FL 33974Lot/LandMLS ID #2026047357, Monica Villa, SWFL Legacy Realty Group LLC. Florida Gulf Coast MLS
- $23,9000.29 acres517 Empire Ave S, Lehigh Acres, FL 33974Lot/LandMLS ID #2026047362, Monica Villa, SWFL Legacy Realty Group LLC. Florida Gulf Coast MLS
