Investment opportunity near Barry University and Miami Shores! This duplex offers separate electric meters and individual water heaters, providing practical features for rental ownership. Expand your investment portfolio or explore living in one unit while renting the other. Conveniently positioned near the university, with shopping, dining, and access to I-95 within the surrounding area. Bring your vision and explore the property’s income potential in this centrally located Miami neighborhood. Information deemed reliable but not guaranteed. Buyer and Buyer’s Agent to independently verify all property information, permitted uses, and rental restrictions.
For sale
Price cut: $25K (11/9)
$550,000
262 NE 111th St, Miami, FL 33161
4beds
11baths
1,564sqft
Duplex
Built in 1948
-- sqft lot
$-- Zestimate®
$352/sqft
$-- HOA
What's special
Separate electric metersIndividual water heaters
- 33 days
- 326
- 32
Zillow last checked:
Listing updated:
Listed by:
Seyon Dunbar 305-761-4120,
EXP Realty LLC
Source: MIAMI,MLS#: A12108660 Originating MLS: A-Miami Association of REALTORS
Facts & features
Interior
Bedrooms & bathrooms
- Bedrooms: 4
- Bathrooms: 11
Heating
- Other
Cooling
- Other, Wall/Window Unit(s)
Features
- Flooring: Other
Interior area
- Total structure area: 1,612
- Total interior livable area: 1,564 sqft
Video & virtual tour
Property
Parking
- Total spaces: 2
Features
- Stories: 1
Lot
- Features: Less Than 1/4 Acre Lot
Details
- Parcel number: 3022310290150
- Zoning: 5700
Construction
Type & style
- Home type: MultiFamily
- Property subtype: Duplex
Materials
- CBS Construction, Other
- Roof: Other
Condition
- Year built: 1948
Utilities & green energy
- Sewer: Other, Septic Tank
Community & HOA
Community
- Subdivision: Miami Highlands Sec A
HOA
- Has HOA: No
Location
- Region: Miami
Financial & listing details
- Price per square foot: $352/sqft
- Tax assessed value: $448,773
- Annual tax amount: $8,935
- Date on market: 10/16/2026
- Listing terms: All Cash,Conventional
Estimated market value
Not available
Estimated sales range
Not available
Not available
Price history
| Date | Event | Price |
|---|---|---|
| 11/9/2026 | Price change | $550,000-4.3%$352/sqft |
Source:  MIAMI #A12108660 Report a problem | ||
| 10/19/2026 | Listed for sale | $575,000+85.5%$368/sqft |
Source: MIAMI #A12108660 Report a problem | ||
| 4/12/2019 | Listing removed | $310,000$198/sqft |
Source: Duffy Realty #A10525510 Report a problem | ||
| 8/22/2018 | Listed for sale | $310,000+19.2%$198/sqft |
Source: Duffy Realty #A10525510 Report a problem | ||
| 8/30/2007 | Sold | $260,000+103.1%$166/sqft |
Source: Public Record Report a problem | ||
| 11/12/2003 | Sold | $128,000+45.5%$82/sqft |
Source: Public Record Report a problem | ||
| 1/6/1999 | Sold | $88,000+11.4%$56/sqft |
Source: Public Record Report a problem | ||
| 4/15/1994 | Sold | $79,000$51/sqft |
Source: Public Record Report a problem | ||
Public tax history
| Year | Property taxes | Tax assessment |
|---|---|---|
| 2025 | $8,935 +7.9% | $440,367 +10% |
| 2024 | $8,285 +13.1% | $400,334 +10% |
| 2023 | $7,328 +33.8% | $363,940 +59.8% |
| 2022 | $5,477 +12.8% | $227,774 +10% |
| 2021 | $4,855 +8.1% | $207,068 +10% |
| 2020 | $4,491 +5.7% | $188,244 +10% |
| 2019 | $4,248 +8.4% | $171,131 +10% |
| 2018 | $3,919 | $155,574 +10% |
| 2017 | $3,919 +11.6% | $141,431 +10% |
| 2016 | $3,511 +14.2% | $128,574 +10% |
| 2015 | $3,073 +6.6% | $116,886 +10% |
| 2014 | $2,882 -1.1% | $106,260 +5.7% |
| 2013 | $2,915 | $100,519 -7.8% |
| 2012 | $2,915 -1% | $109,081 |
| 2011 | $2,945 -10.7% | $109,081 -7% |
| 2010 | $3,296 -23.8% | $117,249 -35.4% |
| 2009 | $4,324 +7.2% | $181,426 +7.4% |
| 2007 | $4,034 +39.9% | $168,886 |
| 2006 | $2,884 | -- |
| 2005 | $2,884 +10.1% | -- |
| 2004 | $2,619 +21.3% | -- |
| 2003 | $2,159 -12.2% | -- |
| 2002 | $2,458 | -- |
| 2001 | $2,458 | -- |
Find assessor info on the county website
Monthly payment
Est. payment
Payment breakdown
Explore the cost of this home by adjusting the details. Changes won't be saved.Climate risks
Neighborhood: 33161


Similar homes
- $589,0003 bd2 ba1.5k sqftBiscayne Blvd Park, Miami, FL 33161For Sale
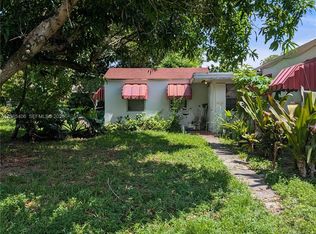
 MLS ID #A12085406, Marcia O'Connor, LoKation. MIAMI
- $579,0003 bd2 ba1.4k sqftBreezeswept Estates, North Miami, FL 33161For Sale
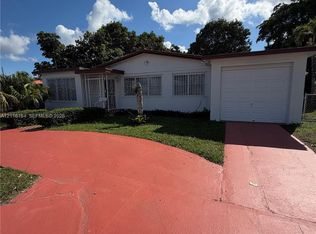 MLS ID #A12116164, Bryan Tirador, Florida Premier Realty. MIAMI
- $575,0004 bd2 ba1.4k sqftLittle River Trs, Miami, FL 33167For Sale
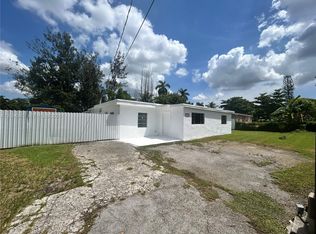 MLS ID #A12084345, Joanne Jones, Compass Florida, LLC. MIAMI
- $555,0004 bd2 ba1.4k sqftStephen Manor, Miami, FL 33150For Sale
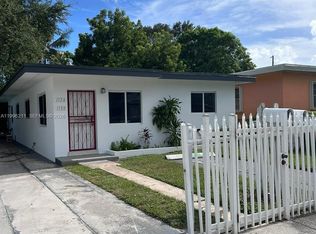 MLS ID #A11996211, Santiago Silva, The Pampas Real Estate Group, LLC.. MIAMI
- $530,0005 bd3 ba1.7k sqftWoodland Addn, Miami, FL 33147For SaleMLS ID #A12117997, Brandon Jean Baptiste, The Keyes Company. MIAMI
- $550,0003 bd2 ba1.2k sqftNichols Heights, North Miami, FL 33168For SaleMLS ID #A12094356, Gisella Rivera, Florida Realty of Miami Corp. MIAMI
- $739,0004 bd3 ba2k sqftBiscayne Shores Corr Plat, Miami, FL 33161For SaleMLS ID #A11965310, Elizabeth Hicks, Dalton Wade Inc. MIAMI
- $499,0002 bd2 ba1.1k sqftDixie Gardens, North Miami, FL 33161For SaleMLS ID #A12068884, Carlos Cruz PA, World Impact Real Estate. MIAMI
- $583,0005 bd3 ba1.6k sqftGordon Dale Pk, Miami, FL 33150For SaleMLS ID #A11885364, Jose Marrero, Coldwell Banker Realty. MIAMI
- $575,0003 bd3 ba948 sqftMiami Gardens Estates Sec, West Park, FL 33023For SaleMLS ID #A12126865, Zuleika Gil, Xcellence. MIAMI
- $619,9004 bd2 ba1.8k sqftPl Of Gardner Park, Miami, FL 33147For SaleMLS ID #A12116749, Roylan Valdivia, United Realty Group Inc. MIAMI
- $555,0003 bd2 ba1.1k sqftNorwood 1st Addn, Miami Gardens, FL 33169For SaleMLS ID #A12072465, German Orellana, Keller Williams Capital Realty. MIAMI
- $480,0004 bd2 ba1.3k sqftRainbow Gardens, Opa Locka, FL 33054For SaleMLS ID #A12119907, Barclay Belizaire, Keller Williams Eagle Realty. MIAMI
- $599,0004 bd2 ba1.8k sqftHialeah 14 Addn, Hialeah, FL 33013For SaleMLS ID #A12089922, Peter Garcia, Iconic Luxury Real Estate Corp. MIAMI
- $595,9006 bd3 ba1.7k sqft17th Ave Manor 2nd Addn, Miami, FL 33142For SaleMLS ID #A12119971, Idalia Nunez, London Foster Realty. MIAMI
- $535,0004 bd2 ba1.7k sqftCarol City 1 St Addn, Miami Gardens, FL 33055For SaleMLS ID #A12091883, Alicia Hayes, The R E Experts of South Fla. MIAMI
- $590,0003 bd1 ba1.3k sqftIndian Mound Park, Miami, FL 33138For SaleMLS ID #A12100540, Allen-Michael Screen, Screen Realty. MIAMI
- $575,9004 bd2 ba1.6k sqftRo-Len Acres, Hallandale, FL 33009For SaleMLS ID #A12074397, James Augustin, AJK Luxury Realty LLC. MIAMI
- $630,0003 bd1 ba1.5k sqftWest Miami Shores Sec D, Miami, FL 33168For SaleMLS ID #A11938777, Frantz Desir, The Moreno Property Group, LLC.. MIAMI
- $550,0004 bd4 ba1.5k sqftSt James Park Northeast P, Hollywood, FL 33020For SaleMLS ID #A12107740, Jabarie Jackson, LPT Realty, LLC. MIAMI
