Opportunity knocks - your chance to acquire city approved plans for 4 Architectural small lot single family homes in prime Silver Lake and coveted Ivanhoe School District - delivered RTI. The existing duplex is SB8 EXEMPT, delivered vacant and the new plans are designed by well known architect Simon Storey who's projects have achieved awards and records in price per foot. Plans feature four 3BD, 3.5BA homes projected at approximately $7,800,000 worth of sales featuring spectacular city views, open floor plans, voluminous spaces, vaulted ceilings and private garages. Sold "as is." Start building this dream project right away.
For sale
Price cut: $200K (10/16)
$2,095,000
2743 Locksley Pl, Los Angeles, CA 90039
2beds
2baths
1,416sqft
Multi Family
Built in 1932
-- sqft lot
$2,053,000 Zestimate®
$1,480/sqft
$-- HOA
What's special
- 35 days
- 74
- 4
Zillow last checked:
Listing updated:
Listed by:
Grant Linscott DRE # 01715002 323-487-9222,
Keller Williams Realty Los Feliz 323-300-1000
Source: CLAW,MLS#: 26994715
Facts & features
Interior
Bedrooms & bathrooms
- Bedrooms: 2
- Bathrooms: 2
Heating
- Forced Air
Cooling
- None
Appliances
- Included: Gas/Electric Range
- Laundry: Laundry Room
Interior area
- Total structure area: 1,416
- Total interior livable area: 1,416 sqft
Property
Parking
- Total spaces: 4
- Parking features: None
- Garage spaces: 2
Features
- Levels: One
- Stories: 1
- Pool features: None
- Spa features: None
Lot
- Size: 7,701 Square Feet
Details
- Additional structures: None
- Parcel number: 5438019015
- Zoning: LARD2
- Special conditions: Standard
- Other equipment: None
Construction
Type & style
- Home type: MultiFamily
- Property subtype: Multi Family
Condition
- Year built: 1932
Utilities & green energy
- Sewer: In Street
- Water: In Street
Community & HOA
Location
- Region: Los Angeles
Financial & listing details
- Price per square foot: $1,480/sqft
- Tax assessed value: $1,022,556
- Date on market: 9/30/2026
Estimated market value
$2,053,000
$1.95M - $2.16M
Not available
Price history
| Date | Event | Price |
|---|---|---|
| 10/16/2026 | Price change | $2,095,000-8.7%$1,480/sqft |
Source:  CLAW #26994715 Report a problem | ||
| 9/30/2026 | Listed for sale | $2,295,000+2%$1,621/sqft |
Source: CLAW #26994715 Report a problem | ||
| 5/1/2025 | Listing removed | $2,250,000$1,589/sqft |
Source: CLAW #24-345680 Report a problem | ||
| 11/21/2024 | Listed for sale | $2,250,000$1,589/sqft |
Source: CLAW #24-345681 Report a problem | ||
| 10/16/2024 | Pending sale | $2,250,000$1,589/sqft |
Source: CLAW #24-345680 Report a problem | ||
| 10/3/2024 | Listed for sale | $2,250,000+8.4%$1,589/sqft |
Source: CLAW #24-345681 Report a problem | ||
| 4/3/2024 | Listing removed | -- |
Source: CLAW #23-297123 Report a problem | ||
| 2/7/2024 | Pending sale | $2,075,000$1,465/sqft |
Source: CLAW #23-297117 Report a problem | ||
| 2/3/2024 | Listed for sale | $2,075,000$1,465/sqft |
Source: CLAW #23-297123 Report a problem | ||
| 1/4/2024 | Listing removed | -- |
Source: CLAW #23-297117 Report a problem | ||
| 1/3/2024 | Listed for sale | $2,075,000$1,465/sqft |
Source: CLAW #23-297123 Report a problem | ||
| 12/4/2023 | Listing removed | -- |
Source: CLAW #23-297123 Report a problem | ||
| 9/22/2023 | Price change | $2,075,000-5.7%$1,465/sqft |
Source: CLAW #23-297117 Report a problem | ||
| 9/6/2023 | Pending sale | $2,200,000$1,554/sqft |
Source: CLAW #23-297123 Report a problem | ||
| 8/10/2023 | Listed for sale | $2,200,000+135.3%$1,554/sqft |
Source: CLAW #23-297123 Report a problem | ||
| 6/6/2017 | Sold | $935,000+5.6%$660/sqft |
Source: Public Record Report a problem | ||
| 4/27/2017 | Pending sale | $885,000$625/sqft |
Source: COMPASS #317002859 Report a problem | ||
| 4/4/2017 | Listed for sale | $885,000$625/sqft |
Source: COMPASS #317002859 Report a problem | ||
Public tax history
| Year | Property taxes | Tax assessment |
|---|---|---|
| 2026 | -- | $1,106,844 +2% |
| 2025 | $13,160 +0.9% | $1,085,142 +2% |
| 2024 | $13,044 +2% | $1,063,866 +2% |
| 2023 | $12,791 -1.4% | $1,043,006 +2% |
| 2022 | $12,967 +7.6% | $1,022,556 +2% |
| 2021 | $12,046 -1% | $1,002,506 +1% |
| 2020 | $12,169 | $992,228 +2% |
| 2019 | $12,169 +4.9% | $972,773 +2% |
| 2018 | $11,596 | $953,700 +23% |
| 2017 | $11,596 +22.9% | $775,200 +2% |
| 2016 | $9,434 +2.3% | $760,000 +142.9% |
| 2015 | $9,223 +135.2% | $312,934 +2% |
| 2014 | $3,920 | $306,805 +2.5% |
| 2012 | -- | $299,431 +2% |
| 2011 | -- | $293,561 +0.8% |
| 2010 | -- | $291,368 -0.2% |
| 2009 | -- | $292,061 +2% |
| 2008 | -- | $286,335 +2% |
| 2007 | -- | $280,721 +2% |
| 2006 | -- | $275,218 |
| 2005 | -- | $275,218 +4% |
| 2004 | -- | $264,532 +1.9% |
| 2003 | -- | $259,684 +2% |
| 2002 | -- | $254,594 +4% |
| 2000 | -- | $244,709 |
Find assessor info on the county website
Monthly payment
Est. payment
Payment breakdown
Explore the cost of this home by adjusting the details. Changes won't be saved.Climate risks
Neighborhood: Silver Lake
- $1,126,3002 bd1 ba920 sqft2749 Locksley Pl, Los Angeles, CA 90039Off Market
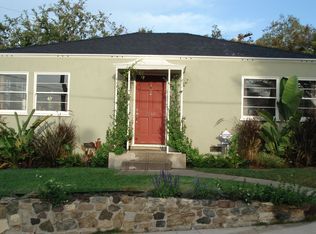
- $2,036,1004 bd3 ba2.4k sqft2740 Waverly Dr, Los Angeles, CA 90039Off Market
- $1,606,0003 bd2 ba1.4k sqft2744 Waverly Dr, Los Angeles, CA 90039Off Market
- $1,834,8003 bd4 ba1.8k sqft2738 Locksley Pl, Los Angeles, CA 90039Off Market
Similar homes
- $1,575,0002 bd2 ba1.4k sqft3615 Edenhurst Ave, Los Angeles, CA 90039For Sale
 MLS ID #21-702598, Bruce Jay DRE # 00559166, Bruce Jay Associates. CLAW
- $--2 bd1 ba1.2k sqft942 Tularosa Dr, Los Angeles, CA 90026Auction
 Auction.com 2
- $--5 bd3 ba1.1k sqft1605-1607 1607 1/2 West 12th St, Los Angeles, CA 90015Auction
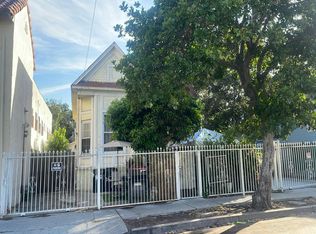 Auction.com 2
- $--3 bd2 ba1.5k sqft6161 Glen Alder St, Los Angeles, CA 90068Auction
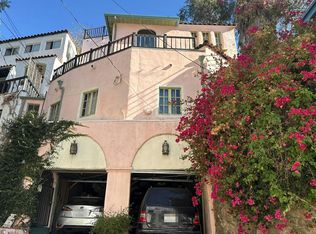 Auction.com 2
