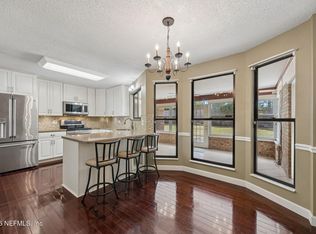
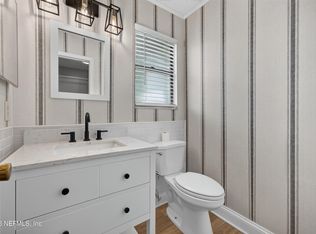
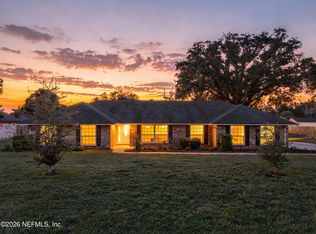
THE PERFECT HOME FOR A NATURE LOVER!!!! Beautiful brick home on a culdesac with 4 bedrooms and 3 baths, sitting on over a 1/2 acre with your very own NATURAL SPRING in the backyard and mature trees. Roof was replaced in 2014 and all new windows replaced on 2017. Kitchen and bathroom renovated in 2019. You'll enjoy the oasis backyard from 3 different wooden decks, large windows and enclosed Florida room. Truly, a very unique property in Jacksonville with close proximity to NAS Jacksonville, Orange Park Medical Center, shopping, downtown and MORE!!!!!
Pre-foreclosure
Est. $397,500
2772 Pebbleridge Ct, Orange Park, FL 32065
4beds
3baths
2,420sqft
SingleFamily
Built in 1988
0.52 Acres Lot
$397,500 Zestimate®
$164/sqft
$-- HOA
Overview
- 49 days
- 341
- 12
Facts & features
Interior
Bedrooms & bathrooms
- Bedrooms: 4
- Bathrooms: 3
Heating
- Forced air, Other, Electric
Cooling
- Central, Other
Appliances
- Included: Dishwasher, Garbage disposal, Microwave, Range / Oven
Features
- Flooring: Tile, Carpet, Linoleum / Vinyl
- Has fireplace: Yes
Interior area
- Total interior livable area: 2,420 sqft
Property
Parking
- Total spaces: 2
- Parking features: Garage - Attached
Features
- Exterior features: Brick
Lot
- Size: 0.52 Acres
Details
- Parcel number: 15042502032734600
Construction
Type & style
- Home type: SingleFamily
Materials
- brick
- Roof: Other
Condition
- Year built: 1988
Community & HOA
Location
- Region: Orange Park
Financial & listing details
- Price per square foot: $164/sqft
- Tax assessed value: $365,903
- Annual tax amount: $5,939
Foreclosure details
Estimated market value
$397,500
$374,000 - $421,000
$2,434/mo
Price history
| Date | Event | Price |
|---|---|---|
| 3/31/2026 | Listing removed | $340,000$140/sqft |
Source:  realMLS #2120831 Report a problem | ||
| 3/20/2026 | Price change | $340,000-2.9%$140/sqft |
Source: realMLS #2120831 Report a problem | ||
| 3/8/2026 | Price change | $350,000-3.6%$145/sqft |
Source: realMLS #2120831 Report a problem | ||
| 2/22/2026 | Price change | $363,000-1.9%$150/sqft |
Source: realMLS #2120831 Report a problem | ||
| 2/17/2026 | Price change | $370,000-1.3%$153/sqft |
Source: realMLS #2120831 Report a problem | ||
| 2/10/2026 | Price change | $375,000-3.6%$155/sqft |
Source: realMLS #2120831 Report a problem | ||
| 2/5/2026 | Price change | $389,000-0.5%$161/sqft |
Source: realMLS #2120831 Report a problem | ||
| 1/19/2026 | Price change | $391,000-0.8%$162/sqft |
Source: realMLS #2120831 Report a problem | ||
| 12/29/2025 | Price change | $394,000-1.5%$163/sqft |
Source: realMLS #2120831 Report a problem | ||
| 12/8/2025 | Listed for sale | $400,000+4.2%$165/sqft |
Source: realMLS #2120831 Report a problem | ||
| 11/3/2025 | Listing removed | $384,000$159/sqft |
Source: realMLS #2106690 Report a problem | ||
| 9/26/2025 | Pending sale | $384,000$159/sqft |
Source: realMLS #2106690 Report a problem | ||
| 9/19/2025 | Price change | $384,000-0.3%$159/sqft |
Source: realMLS #2106690 Report a problem | ||
| 9/2/2025 | Listed for sale | $385,000+7600%$159/sqft |
Source: realMLS #2106690 Report a problem | ||
| 5/14/2025 | Listing removed | $5,000$2/sqft |
Source:  GAMLS #10520706 Report a problem | ||
| 5/12/2025 | Listed for sale | $5,000-98.3%$2/sqft |
Source: GAMLS #10520706 Report a problem | ||
| 6/16/2020 | Sold | $291,000+0.4%$120/sqft |
Source: realMLS #1053308 Report a problem | ||
| 5/18/2020 | Pending sale | $289,900$120/sqft |
Source: EXIT REAL ESTATE GALLERY #1053308 Report a problem | ||
| 5/14/2020 | Listed for sale | $289,900+19.6%$120/sqft |
Source: EXIT REAL ESTATE GALLERY #1053308 Report a problem | ||
| 8/10/2018 | Sold | $242,450-1%$100/sqft |
Source: realMLS #938068 Report a problem | ||
| 7/12/2018 | Pending sale | $244,999$101/sqft |
Source: EXIT REAL ESTATE GALLERY #938068 Report a problem | ||
| 6/8/2018 | Price change | $244,999-1.6%$101/sqft |
Source: EXIT REAL ESTATE GALLERY #938068 Report a problem | ||
| 5/26/2018 | Price change | $249,000-2.7%$103/sqft |
Source: EXIT REAL ESTATE GALLERY #938068 Report a problem | ||
| 5/24/2018 | Listed for sale | $256,000+68.4%$106/sqft |
Source: EXIT REAL ESTATE GALLERY #938068 Report a problem | ||
| 5/28/2014 | Sold | $152,000-35.3%$63/sqft |
Source: Public Record Report a problem | ||
| 9/15/2006 | Sold | $234,900+30.5%$97/sqft |
Source: Public Record Report a problem | ||
| 8/18/2004 | Sold | $180,000$74/sqft |
Source: Public Record Report a problem | ||
Public tax history
| Year | Property taxes | Tax assessment |
|---|---|---|
| 2025 | $5,939 +6.9% | $365,903 +1.3% |
| 2024 | $5,555 +5.4% | $361,260 +1.9% |
| 2023 | $5,271 +12.7% | $354,474 +12.2% |
| 2022 | $4,677 +12.6% | $315,928 +25.4% |
| 2021 | $4,153 +19.5% | $251,962 +18% |
| 2020 | $3,475 | $213,454 +4.6% |
| 2019 | $3,475 +3.2% | $204,128 +21.3% |
| 2018 | $3,368 +67.3% | $168,271 +2.1% |
| 2017 | $2,012 +0.7% | $164,811 +6.1% |
| 2016 | $1,999 +5.2% | $155,308 +0.7% |
| 2015 | $1,900 -2.6% | $154,228 +3.5% |
| 2014 | $1,951 | $149,072 +2.3% |
| 2013 | -- | $145,696 +12.7% |
| 2012 | -- | $129,327 -2.4% |
| 2011 | -- | $132,505 -5.9% |
| 2010 | -- | $140,856 -15.7% |
| 2009 | -- | $167,133 -13% |
| 2008 | -- | $192,019 -7.1% |
| 2007 | -- | $206,769 +7.1% |
| 2006 | -- | $193,107 +18.3% |
| 2005 | -- | $163,184 +26.6% |
| 2004 | -- | $128,885 +1.9% |
| 2003 | -- | $126,482 +4% |
| 2001 | -- | $121,573 +3% |
| 2000 | -- | $118,032 |
Find assessor info on the county website
Monthly payment
Climate risks
Neighborhood: 32065
- $385,1004 bd3 ba2.1k sqft2774 Pebbleridge Ct, Orange Park, FL 32065Off Market
- $336,7004 bd2 ba1.9k sqft2770 Pebbleridge Ct, Orange Park, FL 32065Off Market
- $483,0004 bd4 ba2.3k sqft2776 Graniteridge Ct, Orange Park, FL 32065Off Market

- $327,5003 bd2 ba1.7k sqft2774 Graniteridge Ct, Orange Park, FL 32065Off Market
Similar homes
- $424,9004 bd3 ba2k sqft2834 CIRCLE RIDGE Drive, Orange Park, FL 32065For Sale
 MLS ID #2143297, HANNAH WINDSOR. realMLS
- $345,0003 bd3 ba1.8k sqft2527 SANDLEWOOD Circle, Orange Park, FL 32065For Sale
 MLS ID #2166463, STACIE WILLIAMS. realMLS
- $335,0004 bd3 ba2.7k sqft2822 CIRCLE RIDGE Drive, Orange Park, FL 32065For Sale
 MLS ID #2094615, SHANNON R MURRAY. realMLS
- $425,0003 bd3 ba2.6k sqft2069 MONMOUTH Circle, Orange Park, FL 32073For Sale
 MLS ID #2162860, PAIGE COVINGTON. realMLS
