Seller is motivated to sell.
Pre-foreclosure
Est. $531,100
27841 N 204th Ave, Wittmann, AZ 85361
4beds
3baths
2,480sqft
SingleFamily
Built in 2007
1.01 Acres Lot
$531,100 Zestimate®
$214/sqft
$-- HOA
Overview
- 253 days
- 85
- 7
Facts & features
Interior
Bedrooms & bathrooms
- Bedrooms: 4
- Bathrooms: 3
Heating
- Other
Cooling
- Refrigerator
Features
- Has fireplace: Yes
Interior area
- Total interior livable area: 2,480 sqft
Property
Parking
- Total spaces: 8
- Parking features: Garage
Features
- Exterior features: Stucco
Lot
- Size: 1.01 Acres
Details
- Parcel number: 50348102
Construction
Type & style
- Home type: SingleFamily
Materials
- Roof: Tile
Condition
- Year built: 2007
Community & HOA
Location
- Region: Wittmann
Financial & listing details
- Price per square foot: $214/sqft
- Tax assessed value: $436,300
- Annual tax amount: $1,251
Foreclosure details
Estimated market value
$531,100
$494,000 - $574,000
$2,477/mo
Price history
| Date | Event | Price |
|---|---|---|
| 4/22/2024 | Sold | $496,640-0.6%$200/sqft |
Source: Public Record Report a problem | ||
| 1/23/2024 | Listing removed | $499,750+3%$202/sqft |
Source:  ARMLS #6226363 Report a problem | ||
| 9/15/2023 | Sold | $485,000-3%$196/sqft |
Source: ARMLS #6566825 Report a problem | ||
| 9/1/2023 | Pending sale | $499,999$202/sqft |
Source: ARMLS #6566825 Report a problem | ||
| 8/28/2023 | Listed for sale | $499,999$202/sqft |
Source:  HomeSmart #6566825 Report a problem | ||
| 8/27/2023 | Pending sale | $499,999$202/sqft |
Source: HomeSmart #6566825 Report a problem | ||
| 8/26/2023 | Listed for sale | $499,999$202/sqft |
Source: ARMLS #6566825 Report a problem | ||
| 8/17/2023 | Pending sale | $499,999$202/sqft |
Source: ARMLS #6566825 Report a problem | ||
| 7/21/2023 | Price change | $499,999-7.4%$202/sqft |
Source: ARMLS #6566825 Report a problem | ||
| 6/9/2023 | Listed for sale | $540,000$218/sqft |
Source: ARMLS #6566825 Report a problem | ||
| 6/1/2023 | Listing removed | $540,000-1.6%$218/sqft |
Source: ARMLS #6511251 Report a problem | ||
| 5/11/2023 | Price change | $548,700+10%$221/sqft |
Source: ARMLS #6511251 Report a problem | ||
| 4/22/2023 | Price change | $498,700-9.3%$201/sqft |
Source: ARMLS #6511251 Report a problem | ||
| 1/24/2023 | Listed for sale | $550,000+10.1%$222/sqft |
Source: ARMLS #6511251 Report a problem | ||
| 6/30/2022 | Price change | $499,750-4.8%$202/sqft |
Source: ARMLS #6226363 Report a problem | ||
| 6/28/2022 | Listed for sale | $525,000+12.9%$212/sqft |
Source: ARMLS #6226363 Report a problem | ||
| 4/14/2022 | Sold | $465,000-11.4%$188/sqft |
Source: HomeSmart Intl Solds #6226363_85361 Report a problem | ||
| 2/25/2022 | Pending sale | $525,000$212/sqft |
Source: HomeSmart #6226363 Report a problem | ||
| 4/29/2021 | Price change | $525,000-4.5%$212/sqft |
Source: ARMLS #6226363 Report a problem | ||
| 4/24/2021 | Listed for sale | $550,000+633.3%$222/sqft |
Source: ARMLS #6226363 Report a problem | ||
| 5/27/2015 | Listing removed | $1,299$1/sqft |
Source: RentFeeder Report a problem | ||
| 5/13/2015 | Listed for rent | $1,299+8.3%$1/sqft |
Source: RentFeeder Report a problem | ||
| 2/9/2013 | Listing removed | $1,199 |
Source: Renters Warehouse Report a problem | ||
| 10/23/2012 | Price change | $1,199-7.7% |
Source: Renters Warehouse Report a problem | ||
| 5/24/2012 | Listed for rent | $1,299$1/sqft |
Source: Renters Warehouse Report a problem | ||
| 8/17/2005 | Sold | $75,000$30/sqft |
Source: Public Record Report a problem | ||
Public tax history
| Year | Property taxes | Tax assessment |
|---|---|---|
| 2025 | $1,251 -21.3% | $43,630 -3.8% |
| 2024 | $1,591 -17.2% | $45,350 +114.5% |
| 2023 | $1,921 -2.5% | $21,145 -30.4% |
| 2022 | $1,970 -9.6% | $30,400 +8.5% |
| 2021 | $2,178 +8.8% | $28,010 +5% |
| 2020 | $2,002 +1.4% | $26,670 +6.6% |
| 2019 | $1,974 | $25,020 +8.7% |
| 2018 | $1,974 -0.4% | $23,020 +13.6% |
| 2017 | $1,981 +15.2% | $20,260 +4.5% |
| 2016 | $1,720 +5.7% | $19,380 +8.4% |
| 2015 | $1,628 | $17,880 +31.2% |
| 2014 | -- | $13,630 +5.3% |
| 2013 | -- | $12,950 -2.6% |
| 2012 | -- | $13,300 -5.4% |
| 2011 | -- | $14,060 -34.7% |
| 2010 | -- | $21,520 -27.1% |
| 2009 | -- | $29,500 +130.5% |
| 2008 | -- | $12,800 +10.3% |
| 2007 | -- | $11,600 +168.5% |
| 2006 | -- | $4,320 +42.1% |
| 2005 | -- | $3,040 -52.5% |
| 2004 | -- | $6,400 |
| 2003 | -- | $6,400 +18.5% |
| 2002 | -- | $5,400 |
Find assessor info on the county website
Monthly payment
Climate risks
Neighborhood: 85361

Similar homes
- $--4 bd3 ba1.8k sqft18601 W Cottontail Ln, Wittmann, AZ 85361Auction
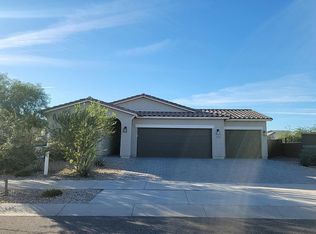 Auction.com 2
- $650,0004 bd3 ba2.8k sqft27710 N 237TH Lane, Wittmann, AZ 85361For Sale
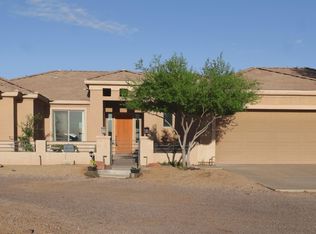 MLS ID #7063641, Kathy Patino, Wise Choice Properties. ARMLS
- $697,0004 bd2 ba1.8k sqft21131 W Morning Vista Drive, Wittmann, AZ 85361For Sale
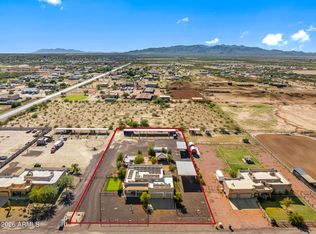 MLS ID #7106234, Lindsey Smith, Century 21 Arizona West. ARMLS
- $509,9004 bd3 ba1.8k sqft30338 N 235th Avenue, Wittmann, AZ 85361For Sale
 MLS ID #7100669, Roderick D Ward, Trelora Realty. ARMLS
