Great investment opportunity! This property is located in Miami, close to the most desirable Little Havana entertainment district. This property is located close to major highways.
For sale
$875,700
2855 NW 22nd Ave, Miami, FL 33142
4beds
4baths
2,386sqft
Quadruplex
Built in 1960
-- sqft lot
$-- Zestimate®
$367/sqft
$-- HOA
What's special
- 1273 days
- 38
- 4
Zillow last checked:
Listing updated:
Listed by:
Roberto Claro 786-298-8214,
Pinnacle Realty of Florida Corp
Source: MIAMI,MLS#: A11389399 Originating MLS: A-Miami Association of REALTORS
Facts & features
Interior
Bedrooms & bathrooms
- Bedrooms: 4
- Bathrooms: 4
Heating
- Central, Electric, Other
Cooling
- Wall/Window Unit(s)
Features
- Flooring: Concrete, Other
Interior area
- Total structure area: 2,386
- Total interior livable area: 2,386 sqft
Video & virtual tour
Property
Parking
- Total spaces: 5
Features
- Stories: 1
Lot
- Features: Less Than 1/4 Acre Lot
Details
- Parcel number: 0131270310020
- Zoning: 6101
Construction
Type & style
- Home type: MultiFamily
- Property subtype: Quadruplex
Materials
- CBS Construction
- Roof: Shingle
Condition
- Year built: 1960
Utilities & green energy
- Sewer: Public Sewer
Community & HOA
Community
- Subdivision: Caples Amd Pl
HOA
- Has HOA: No
Location
- Region: Miami
Financial & listing details
- Price per square foot: $367/sqft
- Tax assessed value: $593,300
- Annual tax amount: $5,917
- Date on market: 5/16/2023
- Listing terms: All Cash,Conventional
Estimated market value
Not available
Estimated sales range
Not available
$3,151/mo
Price history
| Date | Event | Price |
|---|---|---|
| 3/18/2026 | Price change | $875,700-3.8%$367/sqft |
Source:  MIAMI #A11389399 Report a problem | ||
| 12/27/2025 | Price change | $910,000-2%$381/sqft |
Source: MIAMI #A11389399 Report a problem | ||
| 12/16/2025 | Price change | $929,000-5.1%$389/sqft |
Source: MIAMI #A11389399 Report a problem | ||
| 11/26/2025 | Price change | $979,000+5.4%$410/sqft |
Source: MIAMI #A11389399 Report a problem | ||
| 11/17/2025 | Price change | $929,000+3.3%$389/sqft |
Source: MIAMI #A11389399 Report a problem | ||
| 8/18/2025 | Price change | $899,000+3.5%$377/sqft |
Source: MIAMI #A11389399 Report a problem | ||
| 4/22/2025 | Listed for sale | $869,000-4.5%$364/sqft |
Source: MIAMI #A11389399 Report a problem | ||
| 3/15/2025 | Listing removed | $910,000$381/sqft |
Source: MIAMI #A11389399 Report a problem | ||
| 1/22/2025 | Price change | $910,000+4%$381/sqft |
Source: MIAMI #A11389399 Report a problem | ||
| 10/25/2024 | Listed for sale | $875,000$367/sqft |
Source: MIAMI #A11389399 Report a problem | ||
| 10/11/2024 | Listing removed | $875,000$367/sqft |
Source: MIAMI #A11389399 Report a problem | ||
| 10/11/2024 | Price change | $875,000+2.3%$367/sqft |
Source: MIAMI #A11389399 Report a problem | ||
| 9/20/2024 | Price change | $855,000-2.3%$358/sqft |
Source: MIAMI #A11389399 Report a problem | ||
| 9/1/2024 | Price change | $875,000-7.8%$367/sqft |
Source: MIAMI #A11389399 Report a problem | ||
| 8/27/2024 | Price change | $949,000+8.5%$398/sqft |
Source: MIAMI #A11389399 Report a problem | ||
| 6/26/2024 | Price change | $875,000-2.7%$367/sqft |
Source: MIAMI #A11389399 Report a problem | ||
| 1/21/2024 | Price change | $899,000+3.9%$377/sqft |
Source: MIAMI #A11389399 Report a problem | ||
| 11/3/2023 | Price change | $865,000-8.9%$363/sqft |
Source: MIAMI #A11389399 Report a problem | ||
| 8/1/2023 | Price change | $949,000-5.1%$398/sqft |
Source: MIAMI #A11389399 Report a problem | ||
| 5/18/2023 | Listed for sale | $1,000,000+541%$419/sqft |
Source: MIAMI #A11389399 Report a problem | ||
| 5/18/1995 | Sold | $156,000$65/sqft |
Source: Public Record Report a problem | ||
Public tax history
| Year | Property taxes | Tax assessment |
|---|---|---|
| 2025 | $9,727 +23.2% | $433,675 +10% |
| 2024 | $7,898 -10.6% | $394,250 -8.3% |
| 2023 | $8,839 +49.4% | $430,000 +49.8% |
| 2022 | $5,917 -3% | $287,000 |
| 2021 | $6,098 +1% | $287,000 +1.2% |
| 2020 | $6,038 +15.2% | $283,506 +21.1% |
| 2019 | $5,241 +11% | $234,119 +10% |
| 2018 | $4,721 | $212,836 +10% |
| 2017 | $4,721 +7.2% | $193,488 +10% |
| 2016 | $4,402 -37% | $175,899 -43.4% |
| 2015 | $6,982 +4.9% | $310,737 +10% |
| 2014 | $6,657 +5.1% | $282,489 +10% |
| 2013 | $6,333 | $256,809 -8.4% |
| 2012 | $6,333 +5.7% | $280,296 +6.4% |
| 2011 | $5,992 -38.3% | $263,436 -34.3% |
| 2010 | $9,712 -12.1% | $401,182 -16.5% |
| 2009 | $11,052 +85.2% | $480,692 +78.5% |
| 2007 | $5,967 +22.5% | $269,310 |
| 2006 | $4,869 | -- |
| 2005 | $4,869 +7.7% | -- |
| 2004 | $4,520 +44.2% | -- |
| 2003 | $3,135 +17.2% | -- |
| 2002 | $2,675 | -- |
| 2001 | $2,675 | -- |
Find assessor info on the county website
Monthly payment
Est. payment
Payment breakdown
Explore the cost of this home by adjusting the details. Changes won't be saved.Climate risks
Neighborhood: Allapattah


Similar homes
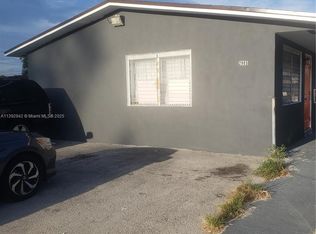
- $810,0004 bd4 ba2.1k sqftCravatts Allapattah Homes, Miami, FL 33142For Sale
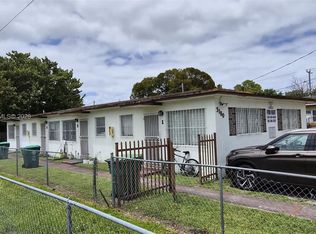
 MLS ID #A12001094, Enolismel Padilla, LP Realty Group. MIAMI
- $875,0007 bd6 ba2k sqftGrapeland, Miami, FL 33145For Sale
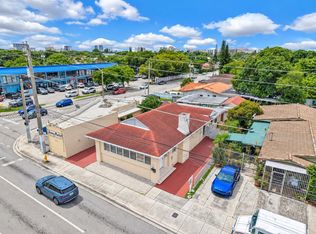 MLS ID #A12069948, Mario Cabrera Benjamin Jr, Chez Realty, LLC.. MIAMI
- $490,0004 bd2 ba1.4k sqftFeatherstone Ridge, Miami, FL 33142For Sale
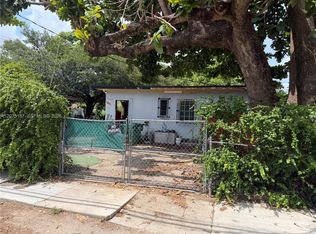 MLS ID #A12075187, Miguel Fuentes, Fausto Commercial Realty Consultants Inc. MIAMI
- $625,0004 bd3 ba1.4k sqftWest End Park Amd Pl, Miami, FL 33142For Sale
 MLS ID #A12025161, Cuindney Mantilla, Miami Residential Group. MIAMI
- $700,0006 bd4 ba2.3k sqftOrchard Villa Extension, Miami, FL 33142For SaleMLS ID #A12071457, Oswaldo Sanchez Robleno, Miami New Realty. MIAMI
- $940,0003 bd3 ba1.7k sqftAmd Plat Of Mia Suburban, Miami, FL 33145For SaleMLS ID #A12105491, Yolymiler Diaz Guillen, Guillen. MIAMI
- $925,0005 bd2 ba1.7k sqftKirkland Heights Amd, Miami, FL 33135For SaleMLS ID #A11937947, Mirlan Saad, LoKation. MIAMI
- $975,0005 bd3 ba1.9k sqftTwelfth St Manors, Miami, FL 33125For SaleMLS ID #A12029166, Helen Borges, Coldwell Banker Realty. MIAMI
- $1,099,0005 bd3 ba1.9k sqftLawrence Est Land Cos Sub, Miami, FL 33129For SaleMLS ID #A12119335, Annia Garcia, Delphi Investment Realty. MIAMI
- $650,0004 bd4 ba2.1k sqftLawrence Estates Land Cos, Miami, FL 33135For SaleMLS ID #A11995942, Christian Giraldo, Pinnacle Realty of Florida Corp. MIAMI
- $759,0006 bd5 ba2.1k sqftSun-Tan Village Sec 3, Hialeah, FL 33010For SaleMLS ID #A12101951, Juan Fiol, Vision Realty of Miami. MIAMI
- $722,5005 bd3 ba1.5k sqftLawrence Est Land Cos Sub, Miami, FL 33130For SaleMLS ID #A12109502, Sagina Salomon, Beachfront Realty Inc. MIAMI
- $780,0003 bd3 ba1.4k sqftBuena Vista Gardens, Miami, FL 33127For SaleMLS ID #A11955346, Natalia Murgueitio, Avanti Way Realty LLC. MIAMI
- $749,0003 bd2 ba1.4k sqftGroveland Pk, Miami, FL 33150For SaleMLS ID #A12104085, Camilo Aristizabal, Elite International Realty Inc. MIAMI
- $675,0006 bd3 ba2.5k sqftHillcrest, Miami, FL 33125For SaleMLS ID #A11850559, Nelly David PA, BHHS EWM Realty. MIAMI
- $899,0006 bd6 ba3.4k sqftBisc Gardens Sec F Pt 1, Miami, FL 33169For SaleMLS ID #A12079196, Magda Robles, Florida Homegain, Corp. MIAMI
- $980,0005 bd5 ba2.1k sqftHollywood Beach Heights S, Hollywood, FL 33021For SaleMLS ID #A12119204, Michael Carioti, Direct Real Estate. MIAMI
- $599,9994 bd3 ba3k sqftGrapeland Sub Rev, Miami, FL 33145For SaleMLS ID #A12005485, Francisco Haedo, Volante Realty Group LLC. MIAMI
- $649,0002 bd1 ba2.8k sqftSilver Bluff Est-Sec B, Miami, FL 33145For SaleMLS ID #A12119799, Carlos Sarria, AGK Realty LLC. MIAMI
- $575,0005 bd2 ba1.5k sqftLa Paloma, Miami, FL 33161For SaleMLS ID #A12122126, Heribert Jean-Louis, Housepower Realty Group. MIAMI
