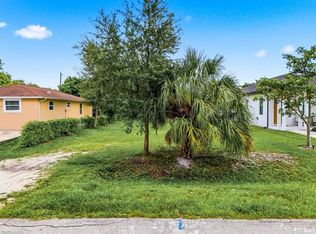
Rare opportunity to build in the heart of Naples! This 0.23-acre (75' x 135') cleared residential lot in the Bayshore/Gateway Triangle area is zoned RMF-6 with the BZO-R1 overlay, allowing either a duplex or a single-family home. This property has Electric and Water already in place a huge savings. Build your dream residence, a rental duplex, or an investment property in one of Naples’ most talked-about, fast-evolving neighborhoods. Enjoy a quick drive to Downtown Naples, Bayshore Drive’s dining and arts district, Naples Botanical Garden, and the beaches. A generous lot size and flexible zoning give builders, investors, and end users room to design. Utilities available: Water & Electric - Survey available! Bring your builder and your vision.
Lot/land
$273,500
2960 Gordon ST, NAPLES, FL 34112
--beds
--baths
10,018Square Feet
Unimproved Land
Built in ----
10,018 Square Feet Lot
$-- Zestimate®
$--/sqft
$-- HOA
What's special
Generous lot size
- 6 days
- 82
- 14
Zillow last checked:
Listing updated:
Listed by:
Cathy Cuba 239-297-6996,
eXp Realty LLC
Source: SWFLMLS,MLS#: 226040000 Originating MLS: Naples
Facts & features
Interior
Features
- Has fireplace: No
Property
Features
- Has view: Yes
- View description: Trees/Woods
- Waterfront features: None
Lot
- Size: 10,018 Square Feet
- Features: See Remarks
- Residential vegetation: Cleared
Details
- Parcel number: 26830240001
Utilities & green energy
- Sewer: None
- Water: Central
- Utilities for property: Electricity Connected, Water Connected
Community & HOA
Community
- Features: Non-Gated
- Subdivision: COL LEE CO GARDENS
HOA
- Has HOA: No
- Amenities included: None
Location
- Region: Naples
Financial & listing details
- Tax assessed value: $330,820
- Annual tax amount: $2,035
- Date on market: 11/12/2026
- Lease term: None/Other
- Electric utility on property: Yes
- Road surface type: Paved
Estimated market value
Not available
Estimated sales range
Not available
Not available
Price history
| Date | Event | Price |
|---|---|---|
| 11/12/2026 | Listed for sale | $273,500-2.3% |
Source:  SWFLMLS #226040000 Report a problem | ||
| 8/3/2026 | Listing removed | $279,999 |
Source: eXp Realty #225061587 Report a problem | ||
| 5/7/2026 | Listed for sale | $279,999+1.9% |
Source: SWFLMLS #225061587 Report a problem | ||
| 10/29/2025 | Price change | $274,9000% |
Source: SWFLMLS #225061587 Report a problem | ||
| 8/22/2025 | Price change | $274,999-8.3% |
Source: SWFLMLS #225061587 Report a problem | ||
| 7/11/2025 | Listed for sale | $299,999 |
Source: SWFLMLS #225061587 Report a problem | ||
| 7/8/2025 | Listing removed | $299,999 |
Source: SWFLMLS #225033619 Report a problem | ||
| 7/2/2025 | Price change | $299,999-11.5% |
Source: SWFLMLS #225033619 Report a problem | ||
| 6/12/2025 | Price change | $339,000-5.6% |
Source: SWFLMLS #225033619 Report a problem | ||
| 5/5/2025 | Price change | $359,000-10% |
Source: SWFLMLS #225033619 Report a problem | ||
| 12/27/2024 | Listed for sale | $399,000-11.3% |
Source: SWFLMLS #224035844 Report a problem | ||
| 11/7/2024 | Listing removed | $450,000 |
Source: SWFLMLS #224035844 Report a problem | ||
| 11/7/2024 | Price change | $450,000-16.7% |
Source: SWFLMLS #224035844 Report a problem | ||
| 7/25/2024 | Price change | $540,000-18.2% |
Source: SWFLMLS #224035844 Report a problem | ||
| 6/27/2024 | Price change | $660,000-2.9% |
Source: SWFLMLS #224035844 Report a problem | ||
| 6/6/2024 | Price change | $680,000-2.2% |
Source: SWFLMLS #224035844 Report a problem | ||
| 4/18/2024 | Listed for sale | $695,000+195.7% |
Source: SWFLMLS #224035844 Report a problem | ||
| 1/4/2006 | Sold | $235,000+291.7% |
Source: Public Record Report a problem | ||
| 12/29/2004 | Sold | $60,000 |
Source: Public Record Report a problem | ||
Public tax history
| Year | Property taxes | Tax assessment |
|---|---|---|
| 2025 | $2,035 +7.5% | $75,220 +10% |
| 2024 | $1,894 -1.7% | $68,382 +10% |
| 2023 | $1,925 -2.6% | $62,165 +10% |
| 2022 | $1,976 +70.1% | $56,514 +10% |
| 2021 | $1,162 +8.2% | $51,376 +10% |
| 2020 | $1,073 +19.3% | $46,705 +10% |
| 2019 | $900 +4.2% | $42,459 +10% |
| 2018 | $863 | $38,599 +10% |
| 2017 | $863 +2.6% | $35,090 +10% |
| 2016 | $841 +25.8% | $31,900 +10% |
| 2015 | $669 +64.3% | $29,000 -15.7% |
| 2014 | $407 -17.2% | $34,400 |
| 2013 | $492 -39.4% | $34,400 -33.5% |
| 2012 | $812 +20% | $51,700 +10% |
| 2011 | $677 -50% | $47,000 -21.1% |
| 2010 | $1,353 -12.5% | $59,600 -39.9% |
| 2009 | $1,547 | $99,200 -19.1% |
| 2008 | $1,547 -19.2% | $122,600 -5.5% |
| 2007 | $1,913 +88.5% | $129,800 -3.7% |
| 2006 | $1,015 | $134,850 +98.7% |
| 2005 | $1,015 +11.7% | $67,878 +12.5% |
| 2004 | $909 +15.4% | $60,323 +19.7% |
| 2003 | $787 +61% | $50,382 +62.8% |
| 2002 | $489 -65.1% | $30,942 -29% |
| 2001 | $1,401 +82.7% | $43,608 |
| 2000 | $767 | -- |
Find assessor info on the county website
Monthly payment
Climate risks
Neighborhood: 34112
Similar homes
- $295,0000.31 acres3195 CONNECTICUT AVE, NAPLES, FL 34112Lot/Land

 MLS ID #226036244, Joseph Caveney, William Raveis Real Estate. SWFLMLS
- $249,9006,534 sqft2960 Coco AVE, NAPLES, FL 34112Lot/Land
 MLS ID #226021338, Nikki Davies, Premiere Plus Realty Company. SWFLMLS
- $325,0006,969 sqft2814 Barrett AVE, NAPLES, FL 34112Lot/Land
 MLS ID #226029044, Robert Rinko III, Waterfront Realty Group Inc. SWFLMLS
- $299,9006,098 sqft3439 Canal ST, NAPLES, FL 34112Lot/Land
 MLS ID #226022248, Nikki Davies, Premiere Plus Realty Company. SWFLMLS
- $275,0003,920 sqftLot 59 Harvest Ct, NAPLES, FL 34112Lot/LandMLS ID #226019231, Lisa Tomasi, Downing Frye Realty Inc.. SWFLMLS
- $279,9996,969 sqftDanford ST, NAPLES, FL 34112Lot/LandMLS ID #226034472, Eliecer Perez, Charming Homes Realty LLC. SWFLMLS
- $239,3008,276 sqft2919 Karen DR, NAPLES, FL 34112Lot/LandMLS ID #226028281, Eric Krajewski, Achieve Realty LLC. SWFLMLS
- $219,0006,969 sqft3060 pinetree DR, NAPLES, FL 34112Lot/LandMLS ID #226022895, Mario Fernandez, Realty One Group MVP. SWFLMLS
- $199,9006,534 sqftBayside ST, NAPLES, FL 34112Lot/LandMLS ID #226021849, Diane Sullivan, Naples Beach & Bay Realty Inc. SWFLMLS
- $212,0006,969 sqftHallendale, Naples, FL 34112Lot/Land
 MLS ID #A11964478, Veronelly Rivas, Canvas Real Estate. MIAMI
- $375,0000.29 acres2596 Holly AVE, NAPLES, FL 34112Lot/LandMLS ID #226004454, Samantha Taravella, PA, John R Wood Properties. SWFLMLS
- $389,0000.29 acres2650 Holly AVE, NAPLES, FL 34112Lot/LandMLS ID #225077265, Samantha Taravella, PA, John R Wood Properties. SWFLMLS
- $375,0000.43 acres3417 Guilford RD, NAPLES, FL 34112Lot/LandMLS ID #226029402, Ryan Chiodo, Compass Florida LLC. SWFLMLS
- $400,0004.9 acres1190 Ivy WAY, NAPLES, FL 34117Lot/LandMLS ID #226002977, Jose Arias, Jr, O K Realty Inc. SWFLMLS
- $299,0002.73 acresXXXX 20th AVE SE, NAPLES, FL 34117Lot/LandMLS ID #226040534, Claire Gogan, EXP Realty LLC. SWFLMLS
- $259,0008,189 sqft27675 Riverdale LN, BONITA SPRINGS, FL 34134Lot/LandMLS ID #226041523, Rosemarie Pyott, Berkshire Hathaway FL Realty. SWFLMLS
- $369,0002.73 acresXXXX 13th ave sw, NAPLES, FL 34116Lot/LandMLS ID #226036025, Carlos Ramirez Hernandez, PA, Marzucco Real Estate. SWFLMLS
- $195,00010,454 sqft335 Porter ST, NAPLES, FL 34113Lot/LandMLS ID #226024771, Kelly Maguire, Downing Frye Realty Inc.. SWFLMLS
- $204,900-- sqft4964 Coach LN, NAPLES, FL 34114Lot/LandMLS ID #226035159, Shelley Freshwater, Motorcoach Resort Realty, Inc. SWFLMLS
- $169,900-- sqft4399 Southern Breeze DR, NAPLES, FL 34114Lot/LandMLS ID #226035444, Shelley Freshwater, Motorcoach Resort Realty, Inc. SWFLMLS
