3, 5, & 33 Circle Drive presents a compelling opportunity to acquire 12 spacious apartments with meaningful income upside in Tiburon, one of Northern California's most affluent communities. The location combines scenic views and a desirable residential setting with convenient access to San Francisco via ferry service and nearby Highway 101. Shopping, restaurants, and grocery stores are a short drive away. Constructed in 1964, the property consists of three wood-frame, stucco-clad buildings with pitched composite shingle roofs. The unit mix includes (3) one-bedroom/one-bath, (7) two-bedroom/two-bath, and (2) three-bedroom/two-bath apartments, all with generous floor plans. Interior features include dishwashers, forced-air heating, and walk-in closets. Every apartment has a private deck, many with impressive views, while the three-bedroom residences also feature fireplaces. Parking consists of 13 covered spaces and eight surface spaces, and each apartment has a dedicated storage closet. The property is part of Tiburon View Apartments, a professionally managed HOA comprising seven investor-owned apartment properties with a total of 68 residences. Shared amenities include a resort-quality swimming pool, bocce court, landscaped courtyard, common laundry facility, and elevator access. HOA dues cover insurance, water, garbage, and common area maintenance, streamlining ownership responsibilities. Below-market rents offer an opportunity to increase income over time. A few apartments have been attractively remodeled, illustrating the potential to achieve substantially higher rents through renovations to the remaining units. With minimal deferred maintenance, investors can direct capital toward improvements that enhance rental appeal and long-term value. The combination of spacious apartments, extensive amenities, and a sought-after Tiburon location positions 3, 5, & 33 Circle Drive as an attractive, long-term investment with a clear value-add strategy.
Active
$5,250,000
3 Circle Drive, Tiburon, CA 94920
23beds
11,508sqft
Multi Family
Built in 1964
-- sqft lot
$-- Zestimate®
$456/sqft
$5,062/mo HOA
What's special
- 4 minutes
- 3
- 1
Zillow last checked:
Listing updated:
Listed by:
John W Garrett DRE #01421403 415-652-8431,
Marcus & Millichap Real Estate 310-909-5500
Source: BAREIS,MLS#: 326091586 Originating MLS: Sonoma
Facts & features
Interior
Bedrooms & bathrooms
- Bedrooms: 23
- Bathrooms: 20
- Full bathrooms: 4
Heating
- See Remarks
Cooling
- See Remarks
Appliances
- Laundry: Coin Operated, Common Area
Features
- Unit 1 - Beds: 3, Baths: 6, Square Footage: 2739 | Unit 2 - Beds: 14, Baths: 14, Square Footage: 6391 | Unit 3 - Beds: 6, Baths: 0, Square Footage: 11508 | Unit 4 - Beds: 0, Baths: 0, Square Footage: 11508
Interior area
- Total structure area: 11,508
- Total interior livable area: 11,508 sqft
Video & virtual tour
Property
Parking
- Total spaces: 21
- Parking features: Covered, Uncovered
- Has uncovered spaces: Yes
Lot
- Size: 0.47 Acres
- Features: None
Details
- Parcel number: 03418206
- Special conditions: Standard
Construction
Type & style
- Home type: MultiFamily
- Property subtype: Multi Family
Condition
- Year built: 1964
Utilities & green energy
- Sewer: Public Sewer
- Water: Public
Community & HOA
Community
- Subdivision: Tiburon View HOA
HOA
- Has HOA: Yes
- Amenities included: Pool
- Services included: Common Areas, Insurance, Maintenance Grounds, Pool, Water
- HOA fee: $5,062 monthly
- HOA name: Tiburon View Homeowners Association
- HOA phone: 415-383-8400
Location
- Region: Tiburon
Financial & listing details
- Price per square foot: $456/sqft
- Tax assessed value: $2,620,304
- Date on market: 10/29/2026
Estimated market value
Not available
Estimated sales range
Not available
Not available
Price history
| Date | Event | Price |
|---|---|---|
| 11/3/2026 | Listed for sale | $5,250,000$456/sqft |
Source:  BAREIS #326091586 Report a problem | ||
Public tax history
| Year | Property taxes | Tax assessment |
|---|---|---|
| 2026 | -- | $2,620,304 +2% |
| 2025 | $41,980 +2.9% | $2,569,031 +2% |
| 2024 | $40,795 +1.1% | $2,518,763 +2% |
| 2023 | $40,343 +1% | $2,469,474 +2% |
| 2022 | $39,960 +1.1% | $2,421,150 +2% |
| 2021 | $39,513 +0.6% | $2,373,777 +1% |
| 2020 | $39,270 +5.6% | $2,349,487 +2% |
| 2019 | $37,177 +10.7% | $2,303,520 +2% |
| 2018 | $33,575 +4.7% | $2,258,454 +2% |
| 2017 | $32,068 +7.5% | $2,214,270 +2% |
| 2016 | $29,839 +0.7% | $2,170,957 +1.5% |
| 2015 | $29,645 +4% | $2,138,427 +2% |
| 2014 | $28,505 | $2,096,642 +0.5% |
| 2013 | -- | $2,087,197 +2% |
| 2012 | -- | $2,046,372 +2% |
| 2011 | -- | $2,006,352 +0.8% |
| 2010 | -- | $1,991,403 -0.2% |
| 2009 | -- | $1,996,129 +2% |
| 2008 | -- | $1,957,089 +2% |
| 2007 | -- | $1,918,814 +2% |
| 2006 | -- | $1,881,285 +2% |
| 2005 | -- | $1,844,497 +2% |
| 2004 | -- | $1,808,429 +10.6% |
| 2003 | -- | $1,634,785 +2% |
| 2002 | -- | $1,602,737 +2% |
| 2001 | -- | $1,571,319 |
Find assessor info on the county website
Monthly payment
Est. payment
Payment breakdown
Explore the cost of this home by adjusting the details. Changes won't be saved.Climate risks
Neighborhood: 94920
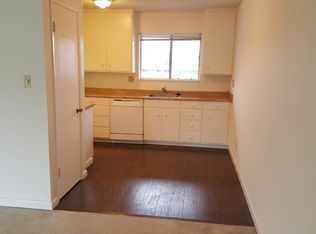

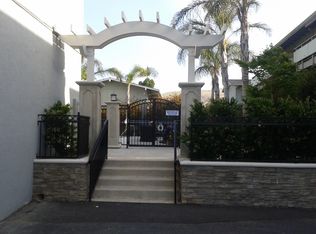

Similar homes
- $3,999,99920 bd-- ba9.2k sqft401 Pine Street, Mill Valley, CA 94941For Sale
 MLS ID #326077893, Katherine Y Raphael, Norcal Commercial. BAREIS
- $5,500,00021 bd16 ba10k sqftMerritt Ave, Oakland, CA 94610For Sale
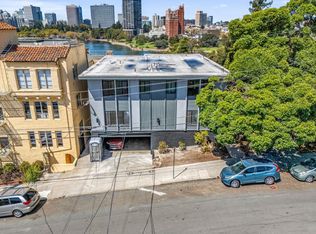 MLS ID #ML82056106, David Hart. MLSListings Inc
- $4,950,00020 bd-- ba8.5k sqft830 Hyde St, San Francisco, CA 94109For Sale
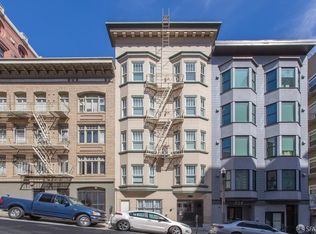 MLS ID #426165348, Adam D. Filly DRE #01354775, Compass Commercial. SFAR
- $7,250,00020 bd-- ba12k sqft4501 Irving St, San Francisco, CA 94122For Sale
 MLS ID #426161154, Adam D. Filly DRE #01354775, Compass Commercial. SFAR
