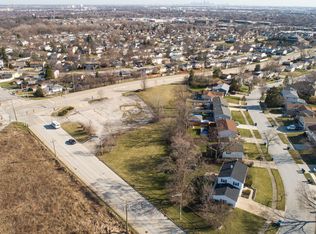
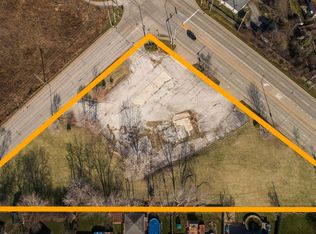
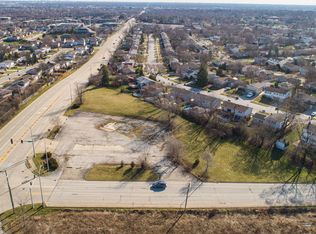
Centrally located wooded vacant lot available for your custom built dream home in the most desirable and scenic neighborhood of Bolingbrook. Close to all the amenities of life, schools, Hospital, Library and Highways I-355, I-55 Route #53. See it for yourself and you will love the place.
Active
$155,900
3 Merrimack Ct, Bolingbrook, IL 60440
--beds
--baths
--sqft
Unimproved Land
Built in ----
-- sqft lot
$-- Zestimate®
$--/sqft
$-- HOA
What's special
- 51 days |
- 205 |
- 4 |
Zillow last checked:
Listing updated:
Listed by:
Muhammad Chaudhry 630-863-7090,
American Eagle Real Estate,Inc
Source: MRED as distributed by MLS GRID,MLS#: 12643956
Facts & features
Interior
Features
- Basement: None
Property
Features
- Frontage length: 87
Lot
- Dimensions: 87X138X138X32X201
Details
- Parcel number: 1202102190030000
- Special conditions: None
Utilities & green energy
- Utilities for property: Electricity Nearby, Natural Gas Nearby, Water Nearby
Community & HOA
Location
- Region: Bolingbrook
Financial & listing details
- Tax assessed value: $95,424
- Annual tax amount: $3,084
- Date on market: 5/11/2026
- Ownership: Fee Simple w/ HO Assn.
- Road surface type: Asphalt
Estimated market value
Not available
Estimated sales range
Not available
$2,097/mo
Price history
| Date | Event | Price |
|---|---|---|
| 5/11/2026 | Listed for sale | $155,900+11.4% |
Source: | ||
| 4/1/2026 | Listing removed | $140,000 |
Source: | ||
| 8/17/2025 | Listed for sale | $140,000-6.7% |
Source: | ||
| 7/1/2025 | Listing removed | $150,000 |
Source: | ||
| 6/1/2025 | Price change | $150,000-9.1% |
Source: | ||
| 11/5/2024 | Listed for sale | $165,000+135.7% |
Source: | ||
| 12/23/2020 | Sold | $70,000-6.7% |
Source: | ||
| 12/12/2020 | Pending sale | $75,000 |
Source: Coldwell Banker Realty #10503322 Report a problem | ||
| 9/2/2019 | Listed for sale | $75,000+15.4% |
Source: Coldwell Banker Residential #10503322 Report a problem | ||
| 8/15/2018 | Sold | $65,000-7% |
Source: | ||
| 7/16/2018 | Pending sale | $69,900 |
Source: Coldwell Banker Residential #10015624 Report a problem | ||
| 7/16/2018 | Listed for sale | $69,900-30.1% |
Source: Coldwell Banker Residential #10015624 Report a problem | ||
| 8/23/2017 | Listing removed | $100,000 |
Source: Land Office Realty #09106121 Report a problem | ||
| 12/27/2015 | Listed for sale | $100,000-13% |
Source: Land Office Realty #09106121 Report a problem | ||
| 5/31/2014 | Listing removed | $115,000 |
Source: RE/MAX Suburban #08488087 Report a problem | ||
| 11/15/2013 | Listed for sale | $115,000+105.4% |
Source: RE/MAX Suburban #08488087 Report a problem | ||
| 12/15/2000 | Sold | $56,000 |
Source: Public Record Report a problem | ||
Public tax history
| Year | Property taxes | Tax assessment |
|---|---|---|
| 2024 | $2,938 +5.8% | $31,808 +11.1% |
| 2023 | $2,776 +8.9% | $28,620 +10.9% |
| 2022 | $2,550 +5% | $25,802 +7% |
| 2021 | $2,429 +2.9% | $24,125 +3.4% |
| 2020 | $2,360 +2.9% | $23,332 +5% |
| 2019 | $2,293 +3.8% | $22,221 +4.5% |
| 2018 | $2,209 +4.6% | $21,268 +5.5% |
| 2017 | $2,113 -2.6% | $20,159 -0.2% |
| 2016 | $2,169 +0.8% | $20,200 +4.1% |
| 2015 | $2,153 | $19,400 |
| 2014 | $2,153 +8.1% | $19,400 +4.9% |
| 2013 | $1,992 +0.2% | $18,500 -8% |
| 2012 | $1,989 +3.4% | $20,100 -9.9% |
| 2011 | $1,923 -2.1% | $22,300 -11.9% |
| 2010 | $1,964 +0.3% | $25,300 -4.9% |
| 2009 | $1,957 -3.9% | $26,600 -10.1% |
| 2008 | $2,037 | $29,600 +9.2% |
| 2007 | -- | $27,100 +10.2% |
| 2006 | $1,732 +4.4% | $24,600 +9.8% |
| 2005 | $1,659 +9.2% | $22,400 +9.8% |
| 2004 | $1,520 +5.1% | $20,400 +4.6% |
| 2003 | $1,445 +3.7% | $19,500 +10.2% |
| 2002 | $1,394 -4.7% | $17,700 |
| 2001 | $1,462 +5.1% | $17,700 |
| 2000 | $1,391 | $17,700 |
Find assessor info on the county website
Monthly payment
Estimated monthly payment$1,822
All calculations are estimates and provided by Zillow, Inc. for informational purposes only. Actual amounts may vary.
HOA fees may include property taxes on listings classified as Co-Ops. Contact the listing agent and/or owner for fee details.
Mortgage interest rates are dependent on a number of factors, including credit score, down payment, and repayment length. Interest rate data provided by Zillow Group Marketplace, Inc. as of 1/1/1970 from various mortgage lenders with which we have lead or other similar arrangements; the Estimated Payment is an average of those rates.
See how much you could borrow to make a competitive offer.
Climate risks
Neighborhood: 60440
Nearby schools
GreatSchools rating
- 7/10Wood View Elementary SchoolGrades: K-5Distance: 0.8 mi
- 8/10Brooks Middle SchoolGrades: 6-8Distance: 0.8 mi
- 8/10Bolingbrook High SchoolGrades: 9-12Distance: 1.7 mi
Schools provided by the listing agent
- District: 365U
Source: MRED as distributed by MLS GRID. This data may not be complete. We recommend contacting the local school district to confirm school assignments for this home.
A local agent can set up tours, give advice and negotiate with sellers.
A local lender can help you make sure your offer is ready when you are.
- Illinois
- Will County
- Bolingbrook
- 60440
- 3 Merrimack Ct
Nearby cities
Nearby zip codes
Other Bolingbrook Topics
