This 1360 square foot condo home has 2 bedrooms and 2.0 bathrooms. This home is located at 300 E Royal Palm Rd #300, Boca Raton, FL 33432.
Pre-foreclosure
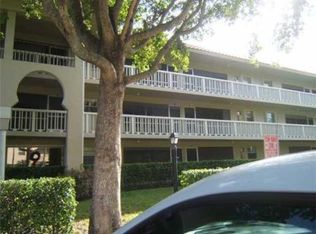
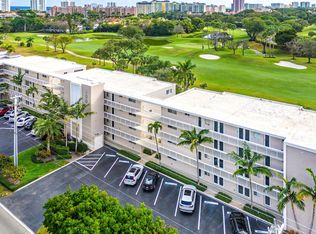
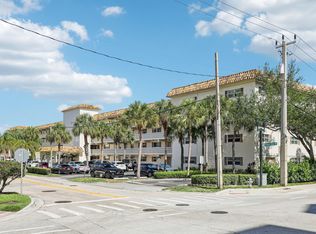
Street View
Est. $643,900
300 E Royal Palm Rd #300, Boca Raton, FL 33432
2beds
2baths
1,360sqft
Condo
Built in 1970
-- sqft lot
$643,900 Zestimate®
$473/sqft
$598/mo HOA
Overview
- 339 days |
- 10 |
- 0 |
Facts & features
Interior
Bedrooms & bathrooms
- Bedrooms: 2
- Bathrooms: 2
Interior area
- Total interior livable area: 1,360 sqft
Property
Details
- Parcel number: 06434729220000300
Construction
Type & style
- Home type: Condo
Materials
- masonry
Condition
- Year built: 1970
Community & HOA
HOA
- Has HOA: Yes
- HOA fee: $598 monthly
Location
- Region: Boca Raton
Financial & listing details
- Price per square foot: $473/sqft
- Tax assessed value: $553,320
- Annual tax amount: $7,752
Visit our professional directory to find a foreclosure specialist in your area that can help with your home search.
Find a foreclosure agentForeclosure details
Estimated market value
$643,900
$592,000 - $708,000
$4,799/mo
Price history
| Date | Event | Price |
|---|---|---|
| 6/17/2022 | Sold | $595,000+194.6%$438/sqft |
Source: Public Record Report a problem | ||
| 8/23/2013 | Sold | $202,000+44.3%$149/sqft |
Source: Public Record Report a problem | ||
| 6/8/2001 | Sold | $140,000$103/sqft |
Source: Public Record Report a problem | ||
Public tax history
| Year | Property taxes | Tax assessment |
|---|---|---|
| 2025 | $7,752 +3% | $481,285 +2.9% |
| 2024 | $7,526 +2.4% | $467,721 +3% |
| 2023 | $7,353 +154.8% | $454,098 +138.3% |
| 2022 | $2,886 +1.3% | $190,547 +3% |
| 2021 | $2,850 +1.5% | $184,997 +1.4% |
| 2020 | $2,807 +1.3% | $182,443 +2.3% |
| 2019 | $2,770 | $178,341 +1.9% |
| 2018 | $2,770 +5.8% | $175,016 +2.1% |
| 2017 | $2,617 +1.3% | $171,416 +2.1% |
| 2016 | $2,583 +0.8% | $167,890 +0.7% |
| 2015 | $2,562 -2% | $166,723 +0.8% |
| 2014 | $2,616 +20.9% | $165,400 +16.6% |
| 2013 | $2,164 +0.7% | $141,833 +1.7% |
| 2012 | $2,150 +2.7% | $139,462 +3% |
| 2011 | $2,094 -3.2% | $135,400 -3.2% |
| 2010 | $2,164 +8.8% | $139,852 +2.7% |
| 2009 | $1,988 +9.7% | $136,175 +0.1% |
| 2008 | $1,813 -8.2% | $136,039 +3% |
| 2007 | $1,975 -5.2% | $132,077 +2.5% |
| 2006 | $2,084 | $128,856 +3% |
| 2005 | -- | $125,103 +3% |
| 2004 | $1,073 +1924% | $121,459 +1.9% |
| 2003 | $53 -97.3% | $119,194 +2.4% |
| 2002 | $1,940 -11.2% | $116,400 +14.8% |
| 2001 | $2,185 +24.8% | $101,400 +25.2% |
| 2000 | $1,751 +7% | $81,000 |
| 1999 | $1,636 | $81,000 |
Find assessor info on the county website
Monthly payment
Estimated monthly payment$1,822
All calculations are estimates and provided by Zillow, Inc. for informational purposes only. Actual amounts may vary.
HOA fees may include property taxes on listings classified as Co-Ops. Contact the listing agent and/or owner for fee details.
Mortgage interest rates are dependent on a number of factors, including credit score, down payment, and repayment length. Interest rate data provided by Zillow Group Marketplace, Inc. as of 1/1/1970 from various mortgage lenders with which we have lead or other similar arrangements; the Estimated Payment is an average of those rates.
See how much you could borrow to make a competitive offer.
Climate risks
Neighborhood: 33432
Nearby schools
GreatSchools rating
- 7/10Boca Raton Elementary SchoolGrades: PK-5Distance: 0.5 mi
- 8/10Boca Raton Community Middle SchoolGrades: 6-8Distance: 2.1 mi
- 6/10Boca Raton Community High SchoolGrades: 9-12Distance: 2.5 mi


- Florida
- Palm Beach County
- Boca Raton
- 33432
- 300 E Royal Palm Rd Unit 300
Nearby cities
Nearby neighborhoods
Nearby zip codes
Other Boca Raton Topics
