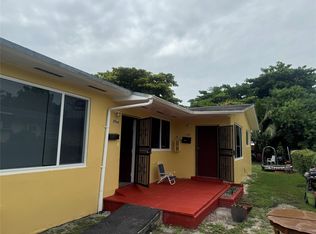
Duplex!! Fabulous location in the heart of Miami! This property features two separate units, each offering 2 bedrooms and 1 bathroom, for a total of 4 bedrooms and 2 bathrooms. One of the units has been completely renovated, featuring new flooring, a brand-new kitchen, new appliances, and updated bathrooms. Excellent investment opportunity with a spacious yard offering ample parking potential for multiple vehicles, a boat, or jet skis. Please do not disturb the tenant. Schedule your showing today!
For sale
$630,000
3000 NW 91st St, Miami, FL 33147
4beds
2baths
1,512sqft
Duplex
Built in 1972
-- sqft lot
$620,100 Zestimate®
$417/sqft
$-- HOA
What's special
New appliancesSpacious yardBrand-new kitchenNew flooringUpdated bathrooms
- 19 days
- 208
- 18
Likely to sell faster than
Zillow last checked:
Listing updated:
Listed by:
Lina Daza 754-802-1160,
Compass Florida, LLC
Source: MIAMI,MLS#: A12108291 Originating MLS: A-Miami Association of REALTORS
Facts & features
Interior
Bedrooms & bathrooms
- Bedrooms: 4
- Bathrooms: 2
Heating
- Central
Cooling
- Central Air
Features
- Flooring: Tile, Vinyl
Interior area
- Total structure area: 1,572
- Total interior livable area: 1,512 sqft
Video & virtual tour
Property
Parking
- Total spaces: 4
Features
- Stories: 1
Lot
- Features: Less Than 1/4 Acre Lot
Details
- Parcel number: 3031040035370
- Zoning: 5100
Construction
Type & style
- Home type: MultiFamily
- Property subtype: Duplex
Materials
- CBS Construction
- Roof: Shingle
Condition
- Year built: 1972
Utilities & green energy
- Sewer: Septic Tank
- Water: Municipal Water
Green energy
- Energy efficient items: Appliances, Construction
Community & HOA
Community
- Subdivision: The Tropics Amd
HOA
- Has HOA: No
Location
- Region: Miami
Financial & listing details
- Price per square foot: $417/sqft
- Tax assessed value: $380,120
- Annual tax amount: $7,167
- Date on market: 10/21/2026
- Listing terms: All Cash,Conventional,FHA
Estimated market value
$620,100
$589,000 - $651,000
$2,743/mo
Price history
| Date | Event | Price |
|---|---|---|
| 10/29/2026 | Listed for sale | $630,000+14.5%$417/sqft |
Source:  MIAMI #A12108291 Report a problem | ||
| 2/22/2024 | Sold | $550,000-3%$364/sqft |
Source: MIAMI #A11491823 Report a problem | ||
| 1/23/2024 | Contingent | $567,000$375/sqft |
Source: MIAMI #A11491823 Report a problem | ||
| 12/4/2023 | Price change | $567,000-3.1%$375/sqft |
Source: MIAMI #A11491823 Report a problem | ||
| 11/27/2023 | Listed for sale | $585,000+67.1%$387/sqft |
Source: MIAMI #A11491823 Report a problem | ||
| 9/29/2023 | Sold | $350,000+180%$231/sqft |
Source: Public Record Report a problem | ||
| 1/3/2002 | Sold | $125,000+43.7%$83/sqft |
Source: Public Record Report a problem | ||
| 11/24/1998 | Sold | $87,000+102.3%$58/sqft |
Source: Public Record Report a problem | ||
| 7/29/1998 | Sold | $43,000+53.6%$28/sqft |
Source: Public Record Report a problem | ||
| 9/9/1993 | Sold | $28,000$19/sqft |
Source: Public Record Report a problem | ||
Public tax history
| Year | Property taxes | Tax assessment |
|---|---|---|
| 2025 | $7,167 -1.5% | $380,120 +9.8% |
| 2024 | $7,278 +36.1% | $346,235 +63.7% |
| 2023 | $5,347 +9.4% | $211,488 +10% |
| 2022 | $4,888 +14.5% | $192,262 +10% |
| 2021 | $4,268 +12.1% | $174,784 +10% |
| 2020 | $3,807 +3.8% | $158,895 +10% |
| 2019 | $3,668 +10.2% | $144,450 +10% |
| 2018 | $3,328 | $131,319 +10% |
| 2017 | $3,328 +5.9% | $119,381 +10% |
| 2016 | $3,143 +13% | $108,529 +10% |
| 2015 | $2,783 +4.6% | $98,663 +10% |
| 2014 | $2,661 +3.5% | $89,694 +10% |
| 2013 | $2,572 | $81,540 -10% |
| 2012 | $2,572 -6.2% | $90,578 -7.9% |
| 2011 | $2,742 -14.8% | $98,399 -13.3% |
| 2010 | $3,218 -24.5% | $113,532 -36.3% |
| 2009 | $4,262 -9.3% | $178,362 -13% |
| 2007 | $4,701 +25% | $204,909 |
| 2006 | $3,760 | -- |
| 2005 | $3,760 +13.1% | -- |
| 2004 | $3,323 +24.4% | -- |
| 2003 | $2,670 +54.7% | -- |
| 2002 | $1,726 | -- |
| 2001 | $1,726 | -- |
Find assessor info on the county website
Monthly payment
Est. payment
Payment breakdown
Explore the cost of this home by adjusting the details. Changes won't be saved.Climate risks
Neighborhood: Tropics Manor
Similar homes
- $650,0004 bd2 ba2k sqftAcme Gulfair, Miami, FL 33147For Sale
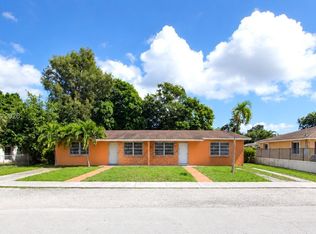
 MLS ID #A12115033, George Theodore, Address Real Estate LLC. MIAMI
- $650,0004 bd3 ba1.6k sqftAcme Gulfair, Miami, FL 33147For Sale
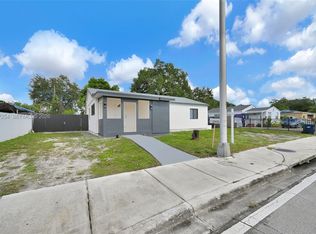 MLS ID #A12117254, Lupita Alonso, Legacy Group Real Estate, LLC.. MIAMI
- $650,0004 bd2 ba1.6k sqft2360 NW 98TH Street, Miami, FL 33147For Sale
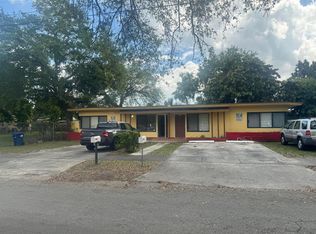
 MLS ID #B26054298, Alfonso Lam, LAM International Realty LLC. BeachesMLS
- $619,9004 bd2 ba1.8k sqftPl Of Gardner Park, Miami, FL 33147For Sale
 MLS ID #A12116749, Roylan Valdivia, United Realty Group Inc. MIAMI
- $619,9005 bd2 ba1.8k sqft22nd Ave Heights, Miami, FL 33147For SaleMLS ID #A12116756, Roylan Valdivia, United Realty Group Inc. MIAMI
- $610,0005 bd2 ba1.8k sqftWoodland Addn, Miami, FL 33147For SaleMLS ID #A12060324, Melissa Miller, EXP Realty, LLC.. MIAMI
- $599,9004 bd2 ba1.4k sqftAcme Gulfair 1st Addn, Miami, FL 33147For SaleMLS ID #A12032326, Kristine Puente, Top Team Realty, LLC.. MIAMI
- $555,0005 bd4 ba1.6k sqftAvocado Park, Miami, FL 33147For SaleMLS ID #A12113148, Natalia Haseitel, Coldwell Banker Realty. MIAMI
- $435,0003 bd2 ba1.8k sqftThe Tropics Amd, Miami, FL 33147For SaleMLS ID #A12125356, Robert Henry, Charles Rutenberg Realty FTL. MIAMI
- $619,9995 bd3 ba1.9k sqftAcme Gulfair, Miami, FL 33147For SaleMLS ID #A12016060, Daniel Guerrero, Precision Real Estate Group. MIAMI
- $635,0003 bd2 ba1.8k sqftShannon Pk 1st Addn, Miami, FL 33147For SaleMLS ID #A12071209, Catuska Fernandez, ACE Florida Realty, LLC. MIAMI
- $589,9994 bd3 ba1.4k sqftRicmar Heights, Miami, FL 33147For SaleMLS ID #A12106217, Jessica Ferrucho Gordillo, Realty One Group Evolution. MIAMI
- $625,0003 bd2 ba1.2k sqftWoodland Addn, Miami, FL 33147For SaleMLS ID #A12029088, Emerio Alonso Agudelo, AVYA Corp. MIAMI
- $599,9994 bd3 ba1.7k sqftThe Tropics Amd, Miami, FL 33147For SaleMLS ID #A12077198, Raymi Nodarse Valdes, Real Estate Craft, LLC.. MIAMI
- $549,0004 bd3 ba1.2k sqftThe Tropics Amd, Miami, FL 33147For SaleMLS ID #A12087944, Taimi Uria, Tower Team Realty, LLC. MIAMI
- $530,0005 bd3 ba1.7k sqftWoodland Addn, Miami, FL 33147For SaleMLS ID #A12117997, Brandon Jean Baptiste, The Keyes Company. MIAMI
- $649,9994 bd2 ba1.5k sqftElizabeth Park, Miami, FL 33147For SaleMLS ID #A12009398, Yamisderky Pelier Barranco, Legacy Group Real Estate, LLC.. MIAMI
- $565,0004 bd2 ba1.6k sqftW Little River Rev, Miami, FL 33147For SaleMLS ID #A12045727, Mario Aedo, Amp Realty Group, LLC. MIAMI
- $450,0004 bd2 ba1.8k sqftAcme Gulfair 2nd Addn, Miami, FL 33147For SaleMLS ID #A12124438, Jonathan Martinez, Rejoice Realty Group, Inc.. MIAMI
- $470,0003 bd2 ba1.3k sqft2451 NW 104TH Street, Miami, FL 33147For SaleMLS ID #B26100878, Gulenka Buergo, Buergos Realty Group Inc.. BeachesMLS
