Great Investment!! Brick 3 units 2nd floor is duplexed to the attic adding 2 more bedrooms and a 2nd bathroom. 1st floor front has one bedroom 1st floor rear 2bedrooms. all units have separated force heat. Tenants pay all utilities . Two car Block garage. All showings after 5:00 pm or weekends 10-5:00 pm
Active
$424,990
3000 S Kedvale Ave, Chicago, IL 60623
8beds
--sqft
Multi Family
Built in ----
-- sqft lot
$417,900 Zestimate®
$--/sqft
$-- HOA
What's special
Two car block garage
- 12 days
- 124
- 15
Zillow last checked:
Listing updated:
Listed by:
Ubaldo Garcia (773)230-0797,
RE/MAX Mi Casa
Source: MRED as distributed by MLS GRID,MLS#: 12785597
Facts & features
Interior
Bedrooms & bathrooms
- Bedrooms: 8
- Bathrooms: 4
- Full bathrooms: 3
Heating
- Forced Air
Features
- Basement: Crawl Space
Property
Parking
- Total spaces: 2
- Parking features: Garage Door Opener, Yes, Garage Owned, Detached, Garage
- Garage spaces: 2
- Has uncovered spaces: Yes
Lot
- Size: 4,170 Square Feet
- Dimensions: 30x139
- Features: Corner Lot
Details
- Parcel number: 16274280190000
- Special conditions: None
Construction
Type & style
- Home type: MultiFamily
- Architectural style: Cape Cod
- Property subtype: Multi Family
Materials
- Brick
- Foundation: Concrete Perimeter
- Roof: Asphalt
Condition
- New construction: No
- Major remodel year: 2015
Utilities & green energy
- Sewer: Public Sewer
- Water: Public
Community & HOA
Community
- Features: Sidewalks, Street Lights, Street Paved
Location
- Region: Chicago
Financial & listing details
- Tax assessed value: $270,000
- Annual tax amount: $4,939
- Date on market: 10/14/2026
- Ownership: Fee Simple
Estimated market value
$417,900
$397,000 - $439,000
$1,787/mo
Price history
| Date | Event | Price |
|---|---|---|
| 10/14/2026 | Listed for sale | $424,990-4.5% |
Source:  MRED as distributed by MLS GRID #12785597 Report a problem | ||
| 10/14/2026 | Listing removed | $445,000 |
Source: MRED as distributed by MLS GRID #12772703 Report a problem | ||
| 9/30/2026 | Listed for sale | $445,000+61.8% |
Source: MRED as distributed by MLS GRID #12772703 Report a problem | ||
| 2/4/2020 | Listing removed | $275,000 |
Source: Americorp Ltd #10608051 Report a problem | ||
| 1/15/2020 | Pending sale | $275,000 |
Source: Americorp Ltd #10608051 Report a problem | ||
| 1/11/2020 | Listed for sale | $275,000+19.6% |
Source: Americorp Ltd #10608051 Report a problem | ||
| 1/1/2018 | Listing removed | $229,999 |
Source: Jameson Commercial #09755168 Report a problem | ||
| 9/19/2017 | Listed for sale | $229,999 |
Source: Jameson Commercial #09755168 Report a problem | ||
| 7/22/2017 | Listing removed | $229,999 |
Source: Jameson Commercial #09510316 Report a problem | ||
| 7/19/2017 | Pending sale | $229,999 |
Source: Jameson Commercial #09510316 Report a problem | ||
| 2/23/2017 | Listed for sale | $229,999+318.2% |
Source: Jameson Commercial #09510316 Report a problem | ||
| 3/31/2015 | Sold | $55,000-85% |
Source: Agent Provided Report a problem | ||
| 8/10/2005 | Sold | $366,000+30.7% |
Source: Public Record Report a problem | ||
| 11/28/2003 | Sold | $280,000 |
Source: Public Record Report a problem | ||
Public tax history
| Year | Property taxes | Tax assessment |
|---|---|---|
| 2024 | $4,763 +133.1% | $27,000 +107.7% |
| 2023 | $2,043 +3.7% | $12,999 |
| 2022 | $1,970 +1.3% | $12,999 |
| 2021 | $1,944 -31% | $12,999 -17.5% |
| 2020 | $2,819 -5.8% | $15,756 -14% |
| 2019 | $2,992 +1.8% | $18,321 |
| 2018 | $2,940 +5.7% | $18,321 +12.4% |
| 2017 | $2,782 +81.2% | $16,298 +92% |
| 2016 | $1,535 +87% | $8,489 +79% |
| 2015 | $821 -68.3% | $4,743 -71.3% |
| 2014 | $2,593 +2.5% | $16,542 |
| 2013 | $2,530 +15% | $16,542 |
| 2012 | $2,201 -24.9% | $16,542 -17.8% |
| 2011 | $2,932 +5.8% | $20,115 |
| 2010 | $2,771 +14% | $20,115 |
| 2009 | $2,430 -14% | $20,115 -23.9% |
| 2008 | $2,827 +15.2% | $26,424 |
| 2007 | $2,454 +8% | $26,424 -10.3% |
| 2006 | $2,273 -5% | $29,463 +78.8% |
| 2005 | $2,394 -10.2% | $16,481 |
| 2004 | $2,666 +2.2% | $16,481 |
| 2003 | $2,608 +7.5% | $16,481 +22.1% |
| 2002 | $2,426 +3.8% | $13,503 |
| 2001 | $2,338 +0.5% | $13,503 |
| 2000 | $2,328 -0.7% | $13,503 +11.4% |
| 1999 | $2,343 | $12,116 |
Find assessor info on the county website
Monthly payment
Est. payment
Payment breakdown
Explore the cost of this home by adjusting the details. Changes won't be saved.Climate risks
Neighborhood: Little Village
Nearby schools


Similar homes
- $430,0009 bd6 ba-- sqft1506 S Spaulding Ave, Chicago, IL 60623New
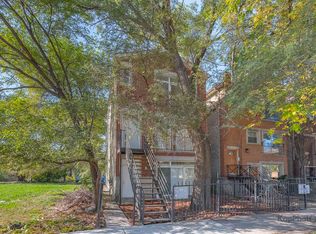 MLS ID #12793037, Jessica Hayes, Century 21 S.G.R., Inc.. MRED as distributed by MLS GRID
- $--6 bd2 ba2.5k sqft1424 S Ridgeway Ave, Chicago, IL 60623Auction
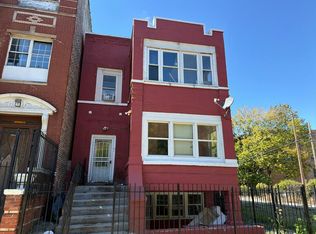 Auction.com 2
- $429,0007 bd4 ba-- sqft2301 S Sacramento Ave, Chicago, IL 60623Active
 MLS ID #12788112, Fernando Lopez, Realty of America, LLC. MRED as distributed by MLS GRID
- $439,9008 bd3 ba-- sqft1233 S Spaulding Ave, Chicago, IL 60623Active
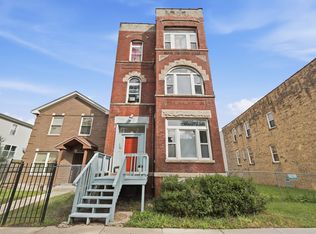 MLS ID #12786758, Anjali Khetarpal, Kale Realty. MRED as distributed by MLS GRID
