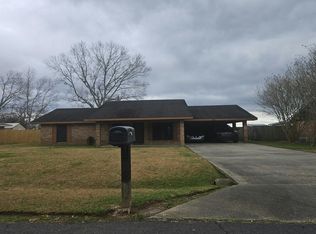
Conveniently located near Opelousas General Hospital, this 3-bedroom, 1-bath home offers a great opportunity for homeowners or investors alike. With easy access to shopping, dining, medical facilities, and other local amenities, the location makes everyday living a breeze. Whether you're looking for a place to call home or an addition to your investment portfolio, this property is full of potential. Schedule your showing today
For sale
Price cut: $3K (10/12)
$84,000
301 Mingo Cir, Opelousas, LA 70570
3beds
1,073sqft
Single Family Residence
Built in ----
0.5 Acres Lot
$-- Zestimate®
$78/sqft
$-- HOA
What's special
- 41 days
- 506
- 23
Zillow last checked:
Listing updated:
Listed by:
Lana Soileau 337-945-1324,
Real Broker, LLC 337-418-9700,
Trai Soileau 337-308-2249,
Real Broker, LLC
Source: RAA,MLS#: 2600008439
Facts & features
Interior
Bedrooms & bathrooms
- Bedrooms: 3
- Bathrooms: 2
- Full bathrooms: 1
- 1/2 bathrooms: 1
Heating
- Central
Cooling
- Central Air
Features
- Formica Counters
- Flooring: Vinyl
- Windows: Window Treatments, Aluminum Frames
- Has fireplace: No
Interior area
- Total interior livable area: 1,073 sqft
Property
Parking
- Total spaces: 1
- Parking features: Carport
- Carport spaces: 1
Features
- Stories: 1
- Fencing: Partial,Wood
Lot
- Size: 0.5 Acres
- Features: 0 to 0.5 Acres, Cul-De-Sac, Level
Details
- Parcel number: 0102991400
- Zoning: Residential
Construction
Type & style
- Home type: SingleFamily
- Architectural style: Traditional
- Property subtype: Single Family Residence
Materials
- Brick Veneer, Frame
- Foundation: Slab
- Roof: Composition
Condition
- Resale
Utilities & green energy
- Electric: Elec: CLECO
- Sewer: Public Sewer
Community & HOA
Community
- Subdivision: Indian Hills
Location
- Region: Opelousas
Financial & listing details
- Price per square foot: $78/sqft
- Tax assessed value: $86,300
- Annual tax amount: $313
- Date on market: 9/8/2026
- Electric utility on property: Yes
Estimated market value
Not available
Estimated sales range
Not available
$898/mo
Price history
| Date | Event | Price |
|---|---|---|
| 10/12/2026 | Price change | $84,000-3.4%$78/sqft |
Source:  RAA #2600008439 Report a problem | ||
| 9/18/2026 | Listed for sale | $87,000$81/sqft |
Source: RAA #2600008439 Report a problem | ||
| 9/16/2026 | Pending sale | $87,000$81/sqft |
Source: RAA #2600008439 Report a problem | ||
| 9/8/2026 | Listed for sale | $87,000-2.1%$81/sqft |
Source: RAA #2600008439 Report a problem | ||
| 10/11/2023 | Sold | -- |
Source: RAA #23008572 Report a problem | ||
| 9/21/2023 | Pending sale | $88,900$83/sqft |
Source: RAA #23008572 Report a problem | ||
| 9/19/2023 | Listed for sale | $88,900$83/sqft |
Source: RAA #23008572 Report a problem | ||
| 8/11/2023 | Sold | -- |
Source: Public Record Report a problem | ||
Public tax history
| Year | Property taxes | Tax assessment |
|---|---|---|
| 2025 | $313 | $8,630 |
| 2024 | $313 +22.8% | $8,630 +24.5% |
| 2023 | $255 +2.3% | $6,930 |
| 2022 | $249 | $6,930 |
| 2021 | $249 +403.5% | $6,930 |
| 2020 | $49 +9.5% | $6,930 +9.5% |
| 2019 | $45 | $6,330 |
| 2017 | -- | $6,330 +1.4% |
| 2015 | $269 +0.2% | $6,240 |
| 2013 | $269 | $6,240 |
| 2012 | $269 -8.5% | $6,240 -10.9% |
| 2010 | $294 | $7,000 |
Find assessor info on the county website
Monthly payment
Est. payment
Payment breakdown
Explore the cost of this home by adjusting the details. Changes won't be saved.Climate risks
Neighborhood: 70570

Similar homes
- $--3 bd2 ba1.3k sqft292 Avenue Of The Acadians, Opelousas, LA 70570Auction
 Auction.com 2
- $79,9003 bd1 ba1.1k sqft605 Choctaw Dr, Opelousas, LA 70570For Sale

 MLS ID #2600006019, Heidi Silvia, Keller Williams Realty Acadiana. RAA
- $76,0003 bd2 ba1.2k sqft1359 Cherokee Dr, Opelousas, LA 70570For Sale
 MLS ID #2600007241, Crystal Brooks, Reality Realty, LLC. RAA
- $85,0003 bd2 ba1.6k sqft1122 S Court St, Opelousas, LA 70570For Sale
 MLS ID #2600004359, Kathleen H Theriot, NextHome Cutting Edge Realty. RAA
- $75,0003 bd2 ba1.2k sqft200 N Oleander St, Opelousas, LA 70570For SaleMLS ID #2600004035, Jamie Knight, Real Broker, LLC. RAA
- $95,0003 bd1 ba1k sqft1457 Louisiana Ave #743, Opelousas, LA 70570For SaleMLS ID #2600004571, Kiwi Bautista, Epique Realty. RAA
- $75,0003 bd1 ba1.2k sqft139 Gerald St, Opelousas, LA 70570For SaleMLS ID #2600008015, Nah Senpeng, Keller Williams Realty Acadiana. RAA
- $88,5002 bd1 ba1k sqft1937 Prairie Ronde Hwy, Opelousas, LA 70570For SaleMLS ID #2600004942, Victoria S Broussard, AXEN Realty. RAA
- $59,9003 bd1 ba920 sqft808 N Market St, Opelousas, LA 70570For SaleMLS ID #2600006236, Robbie Breaux, Real Broker, LLC. RAA
- $70,0003 bd1 ba984 sqft419 Louisiana Ave, Opelousas, LA 70570For SaleMLS ID #2600000057, Stacie R Sibille, Robins Real Estate, LLC. RAA
- $65,0003 bd1 ba1.3k sqft2233 Ledoux Cir, Opelousas, LA 70570For SaleMLS ID #2600003557, Jamie Knight, Real Broker, LLC. RAA
- $75,9002 bd1 ba1.4k sqft827 East St, Opelousas, LA 70570For SaleMLS ID #2500005729, Toni L Effingger, RE/MAX Excellence. RAA
- $44,0004 bd1 ba1.4k sqft914 Wallior St, Opelousas, LA 70570For SaleMLS ID #2600005605, Adrian Davis, Real Broker, LLC. RAA
- $125,0003 bd2 ba1.4k sqft954 Choctaw Dr, Opelousas, LA 70570For SaleMLS ID #2020021699, Ursula Jenkins, Sovereign, LLC. RAA
- $115,0002 bd1 ba953 sqft1870 Royal St, Opelousas, LA 70570For SaleMLS ID #2600000741, Lana Soileau, Real Broker, LLC. RAA
- $79,0003 bd2 ba1.2k sqft1305 Etienne St, Ville Platte, LA 70586For SaleMLS ID #2600006935, Shaguandra M Butler, Impact Realty, LLC. RAA
- $64,7602 bd1 ba900 sqft1603 Brown St, Opelousas, LA 70570For SaleMLS ID #2600003088, Abbie G Young, Oneness Real Estate, LLC. RAA
- $45,0002 bd1 ba1.2k sqft736 N Court St, Opelousas, LA 70570For SaleMLS ID #2020023754, Toni L Effingger, RE/MAX Excellence. RAA
- $69,0003 bd2 ba1.1k sqft196 Bellanise Rd, Port Barre, LA 70577For SaleMLS ID #2020024208, Angela D Angello, Reality Realty, LLC. RAA
