Welcome to 301 N Simon St in Visalia! This charming 3-bedroom, 2-bath home offers a warm and inviting feel with a comfortable, functional layout. Enjoy a spacious yard with plenty of room for relaxing, entertaining, and family gatherings. This well-kept home offers comfortable living and is ready to welcome its new owners.
Pending
$340,000
301 N Simon Street, Visalia, CA 93292
3beds
1,200sqft
Single Family Residence, Residential
Built in 1977
7,989 Square Feet Lot
$342,800 Zestimate®
$283/sqft
$-- HOA
What's special
Spacious yardWarm and inviting feelComfortable functional layout
- 45 days
- 20
- 0
Likely to sell faster than
Zillow last checked:
Listing updated:
Listed by:
Cynthia Mares 559-798-8214,
Realty One Group Action
Source: TCMLS,MLS#: 244194
Facts & features
Interior
Bedrooms & bathrooms
- Bedrooms: 3
- Bathrooms: 2
- Full bathrooms: 2
Heating
- Central
Cooling
- Ceiling Fan(s), Central Air, Gas
Features
- Has fireplace: Yes
- Fireplace features: Living Room
Interior area
- Total structure area: 1,200
- Total interior livable area: 1,200 sqft
Property
Parking
- Total spaces: 2
- Parking features: Garage
- Garage spaces: 2
Features
- Stories: 1
Lot
- Size: 7,989 Square Feet
Details
- Parcel number: 103210027000
Construction
Type & style
- Home type: SingleFamily
- Property subtype: Single Family Residence, Residential
Materials
- Roof: Shingle
Condition
- New construction: No
- Year built: 1977
Utilities & green energy
- Sewer: Public Sewer
- Water: Public
- Utilities for property: Cable Connected, Electricity Connected, Natural Gas Connected, Sewer Connected, Water Connected
Community & HOA
HOA
- Has HOA: No
Location
- Region: Visalia
Financial & listing details
- Price per square foot: $283/sqft
- Tax assessed value: $177,567
- Date on market: 9/18/2026
- Cumulative days on market: 47 days
- Electric utility on property: Yes
Estimated market value
$342,800
$326,000 - $360,000
$1,937/mo
Price history
| Date | Event | Price |
|---|---|---|
| 9/22/2026 | Pending sale | $340,000$283/sqft |
Source:  TCMLS #244194 Report a problem | ||
| 9/18/2026 | Listed for sale | $340,000+126.7%$283/sqft |
Source: TCMLS #244194 Report a problem | ||
| 3/10/2017 | Sold | $150,000+89.9%$125/sqft |
Source: Public Record Report a problem | ||
| 10/27/2000 | Sold | $79,000$66/sqft |
Source: Public Record Report a problem | ||
Public tax history
| Year | Property taxes | Tax assessment |
|---|---|---|
| 2026 | -- | $177,567 +2% |
| 2025 | $1,894 -6.6% | $174,086 +2% |
| 2024 | $2,028 +13.4% | $170,673 +2% |
| 2023 | $1,789 -28.8% | $167,327 +2% |
| 2022 | $2,514 +46.9% | $164,047 +2% |
| 2021 | $1,712 +1% | $160,830 +1% |
| 2020 | $1,695 +2.8% | $159,181 +2% |
| 2019 | $1,649 +2.7% | $156,060 +2% |
| 2018 | $1,605 +57.6% | $153,000 +49.2% |
| 2017 | $1,018 +2.7% | $102,576 +2% |
| 2016 | $992 | $100,565 +1.5% |
| 2015 | $992 +3.2% | $99,054 +2% |
| 2014 | $961 | $97,114 +0.5% |
| 2013 | -- | $96,675 +2% |
| 2012 | -- | $94,779 +2% |
| 2011 | -- | $92,920 +4.6% |
| 2007 | -- | $88,855 +2% |
| 2006 | -- | $87,112 +2% |
| 2005 | -- | $85,404 +2% |
| 2004 | -- | $83,729 +1.9% |
| 2003 | -- | $82,192 +2% |
| 2002 | -- | $80,580 +2% |
| 2001 | -- | $79,000 |
Find assessor info on the county website
Monthly payment
Est. payment
Payment breakdown
Explore the cost of this home by adjusting the details. Changes won't be saved.Climate risks
Neighborhood: East Lynn

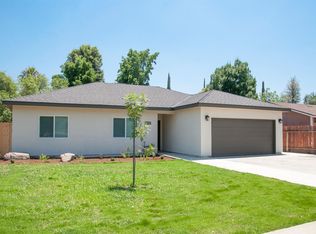
Similar homes
- $340,0003 bd2 ba1.1k sqft215 S Crumal Street, Visalia, CA 93292For Sale
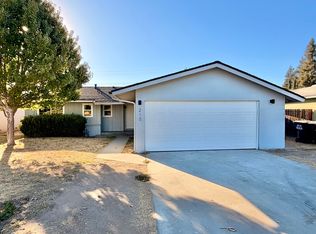 MLS ID #244764, Nestor Varela, Legacy Real Estate Inc. TCMLS
- $410,0003 bd2 ba1.5k sqft3637 E Center Court, Visalia, CA 93292For Sale
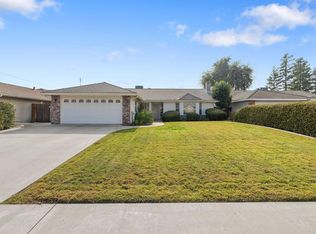 MLS ID #244923, Candy Alvarez, Century 21 Select Real Estate. TCMLS
- $335,0003 bd2 ba1.5k sqft1517 N Norman Street, Visalia, CA 93292For Sale
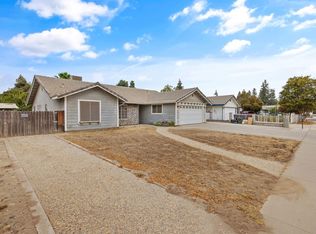 MLS ID #244768, Toni Marie Rogers, Century 21 Select Real Estate. TCMLS
- $345,0003 bd2 ba1.1k sqft1008 N Manzanita St, Visalia, CA 93292For Sale
 MLS ID #649583, Julie Turner. Fresno MLS
Local buyer's agents are ready to help
