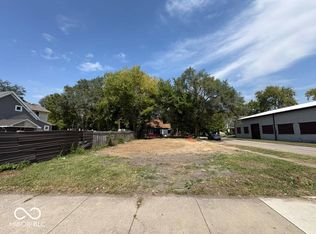
Prime Development Opportunity! Residential lot with Utilities already on it and this property is being sold as a cleared lot, offering the perfect blank canvas for your next project. This lot must be sold together with the property lot at 2850-2852 E New York St (Located at the front) MLS: 22126670. The new owner could combine the two lots and develop a spacious duplex with parking spaces.
Active
Price cut: $6.9K (10/1)
$41,999
304 N Oxford St, Indianapolis, IN 46201
--beds
--baths
1,742Square Feet
Unimproved Land, Residential Lots
Built in ----
1,742 Square Feet Lot
$-- Zestimate®
$--/sqft
$-- HOA
What's special
Cleared lot
- 39 days
- 33
- 0
Zillow last checked:
Listing updated:
Listed by:
Leixa Molina realestategrouplms@gmail.com,
BluPrint Real Estate Group
Source: MIBOR as distributed by MLS GRID,MLS#: 22126679
Facts & features
Property
Lot
- Size: 1,742 Square Feet
- Features: City
- Topography: Filled
Details
- Parcel number: 491005186058000101
- Zoning: Residential
- Zoning description: Single Family
- Horse amenities: None
Utilities & green energy
- Water: Municipal Water on Site
Community & HOA
Community
- Subdivision: 110 E Washington
Location
- Region: Indianapolis
Financial & listing details
- Tax assessed value: $53,600
- Annual tax amount: $2,022
- Date on market: 9/17/2026
- Cumulative days on market: 40 days
- Road surface type: Dirt
Estimated market value
Not available
Estimated sales range
Not available
Not available
Price history
| Date | Event | Price |
|---|---|---|
| 10/1/2026 | Price change | $41,999-14.1% |
Source:  MIBOR as distributed by MLS GRID #22126679 Report a problem | ||
| 9/17/2026 | Listed for sale | $48,900+11.1% |
Source: MIBOR as distributed by MLS GRID #22126679 Report a problem | ||
| 6/24/2026 | Listing removed | $44,000 |
Source: MIBOR as distributed by MLS GRID #22103118 Report a problem | ||
| 6/16/2026 | Price change | $44,000-18.5% |
Source: MIBOR as distributed by MLS GRID #22103118 Report a problem | ||
| 5/28/2026 | Price change | $54,000-10% |
Source: MIBOR as distributed by MLS GRID #22103118 Report a problem | ||
| 5/20/2026 | Listed for sale | $60,000+36.7% |
Source: MIBOR as distributed by MLS GRID #22103118 Report a problem | ||
| 12/22/2025 | Listing removed | $43,900 |
Source: MIBOR as distributed by MLS GRID #22069433 Report a problem | ||
| 10/21/2025 | Listed for sale | $43,900+631.7% |
Source: MIBOR as distributed by MLS GRID #22069433 Report a problem | ||
| 1/21/2020 | Sold | $6,000 |
Source: Public Record Report a problem | ||
Public tax history
| Year | Property taxes | Tax assessment |
|---|---|---|
| 2025 | $1,108 +4.3% | $53,600 +14.8% |
| 2024 | $1,063 +1.8% | $46,700 +4.2% |
| 2023 | $1,044 +37.9% | $44,800 +1.4% |
| 2022 | $757 +14.3% | $44,200 +34.8% |
| 2021 | $662 +5.5% | $32,800 +14.7% |
| 2020 | $628 +13.6% | $28,600 +7.5% |
| 2019 | $553 +10.7% | $26,600 +14.7% |
| 2018 | $499 -1.3% | $23,200 +5.5% |
| 2017 | $506 +11.4% | $22,000 -0.5% |
| 2016 | $454 +12.2% | $22,100 +18.2% |
| 2014 | $404 +2.4% | $18,700 -5.1% |
| 2013 | $395 | $19,700 +11.9% |
| 2012 | $395 | $17,600 -4.9% |
| 2011 | -- | $18,500 |
| 2010 | $144 +11.4% | $18,500 |
| 2009 | $129 | $18,500 +30.3% |
| 2007 | -- | $14,200 |
Find assessor info on the county website
Monthly payment
Climate risks
Neighborhood: Near Eastside


Similar homes
- $55,0001,742 sqft440 Spruce St, Indianapolis, IN 46201Active
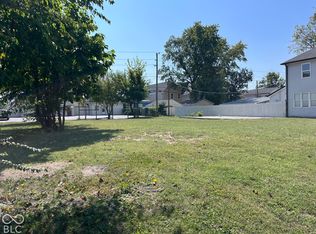 MLS ID #22126669, Luke Granholm, @properties. MIBOR as distributed by MLS GRID
- $55,0001,742 sqft444 Spruce St, Indianapolis, IN 46201Active
 MLS ID #22126674, Luke Granholm, @properties. MIBOR as distributed by MLS GRID
- $40,0004,791 sqft423 N Oxford St, Indianapolis, IN 46201Active
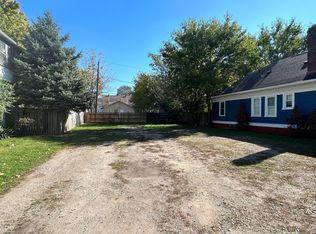 MLS ID #22007232, Joel Newman, Blue Sky Realty Group. MIBOR as distributed by MLS GRID
- $37,5003,920 sqft530 N Dearborn St, Indianapolis, IN 46201Active
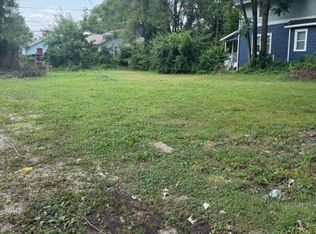 MLS ID #22116872, Sarah Skidmore, @properties. MIBOR as distributed by MLS GRID
