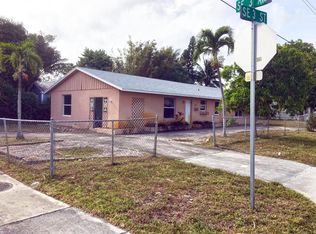
$2,950
3 bd|2 ba|-- sqft
310 SE 3rd Ave, Delray Beach, FL 33483
For Rent
Zillow last checked:
Listing updated:
Dror Gerges 561-703-9428,
Leader Realty
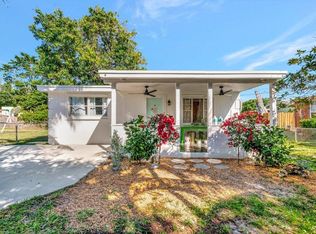
$806,500
$766,000 - $847,000
$4,300/mo
| Date | Event | Price |
|---|---|---|
| 6/10/2026 | Price change | $849,000+1.2%$1,056/sqft |
Source: | ||
| 3/18/2026 | Listed for sale | $839,000-0.1%$1,044/sqft |
Source: | ||
| 3/5/2026 | Listing removed | $839,900$1,045/sqft |
Source: | ||
| 1/19/2026 | Price change | $839,900-2.3%$1,045/sqft |
Source: | ||
| 12/13/2025 | Price change | $859,900-1.1%$1,070/sqft |
Source: | ||
| 12/1/2025 | Price change | $869,900-1%$1,082/sqft |
Source: | ||
| 11/5/2025 | Price change | $879,000-1.1%$1,093/sqft |
Source: | ||
| 10/13/2025 | Price change | $889,000-1.1%$1,106/sqft |
Source: | ||
| 9/4/2025 | Listed for sale | $899,000+19.9%$1,118/sqft |
Source: | ||
| 12/13/2024 | Sold | $750,000-3.2%$933/sqft |
Source: | ||
| 10/17/2024 | Listed for sale | $775,000-8.8%$964/sqft |
Source: | ||
| 7/8/2024 | Listing removed | -- |
Source: BeachesMLS #R10977180 Report a problem | ||
| 6/29/2024 | Listing removed | -- |
Source: | ||
| 6/10/2024 | Price change | $850,000-5.6%$1,057/sqft |
Source: | ||
| 5/3/2024 | Listed for rent | $3,200$4/sqft |
Source: BeachesMLS #R10977180 Report a problem | ||
| 5/2/2024 | Listing removed | -- |
Source: Zillow Rentals Report a problem | ||
| 4/11/2024 | Listed for sale | $900,000+309.1%$1,119/sqft |
Source: | ||
| 3/25/2024 | Listed for rent | $3,200-13.5%$4/sqft |
Source: Zillow Rentals Report a problem | ||
| 2/14/2024 | Listing removed | -- |
Source: Zillow Rentals Report a problem | ||
| 10/3/2023 | Listed for rent | $3,700$5/sqft |
Source: Zillow Rentals Report a problem | ||
| 8/11/2023 | Listing removed | -- |
Source: Zillow Rentals Report a problem | ||
| 6/24/2023 | Listed for rent | $3,700$5/sqft |
Source: Zillow Rentals Report a problem | ||
| 5/18/2023 | Listing removed | -- |
Source: Zillow Rentals Report a problem | ||
| 5/1/2023 | Listed for rent | $3,700$5/sqft |
Source: Zillow Rentals Report a problem | ||
| 5/1/2023 | Listing removed | -- |
Source: BeachesMLS #R10866408 Report a problem | ||
| 7/13/2015 | Sold | $220,000-30.2%$274/sqft |
Source: | ||
| 7/11/2006 | Sold | $315,000+826.5%$392/sqft |
Source: Public Record Report a problem | ||
| 8/27/1997 | Sold | $34,000+81.8%$42/sqft |
Source: Public Record Report a problem | ||
| 1/28/1997 | Sold | $18,700$23/sqft |
Source: Public Record Report a problem | ||
| Year | Property taxes | Tax assessment |
|---|---|---|
| 2025 | $9,937 +57.4% | $524,134 +85.4% |
| 2024 | $6,314 -0.2% | $282,708 +10% |
| 2023 | $6,324 +17% | $257,007 +10% |
| 2022 | $5,404 +19.4% | $233,643 +10% |
| 2021 | $4,525 +7.1% | $212,403 +8.4% |
| 2020 | $4,224 +1.8% | $195,930 +6.4% |
| 2019 | $4,149 | $184,128 -3.5% |
| 2018 | $4,149 +10.2% | $190,833 +14.7% |
| 2017 | $3,763 +8.8% | $166,350 +20.2% |
| 2016 | $3,458 +9.5% | $138,338 +34.5% |
| 2015 | $3,158 +15.1% | $102,843 -8.8% |
| 2014 | $2,744 +189.9% | $112,821 +61.4% |
| 2013 | $947 -1% | $69,906 +1.7% |
| 2012 | $956 -12% | $68,737 -11.4% |
| 2011 | $1,086 -39.6% | $77,614 -28.2% |
| 2010 | $1,800 -41% | $108,126 -34.7% |
| 2009 | $3,047 -9.1% | $165,466 -15.1% |
| 2008 | $3,354 -16.1% | $194,876 -9.4% |
| 2007 | $3,999 -12.8% | $215,033 +7.5% |
| 2006 | $4,588 | $200,052 +78.8% |
| 2005 | -- | $111,913 +27% |
| 2004 | $1,311 +729.6% | $88,150 +16.9% |
| 2003 | $158 -89.5% | $75,392 +34.1% |
| 2002 | $1,512 +27.6% | $56,223 +33.4% |
| 2001 | $1,184 +14.2% | $42,134 +15.4% |
| 2000 | $1,038 +31.1% | $36,504 +9.4% |
| 1999 | $792 | $33,369 |
Find assessor info on the county website
Source: BeachesMLS. This data may not be complete. We recommend contacting the local school district to confirm school assignments for this home.
A local agent can set up tours, give advice and negotiate with sellers.