Welcome to this inviting 1-story home featuring 3 bedrooms and 2 full bathrooms! The functional floor plan offers comfortable living spaces along with a versatile flex room that can be used as an office, bonus room, or additional living space. Enjoy a spacious backyard with plenty of room for outdoor activities and entertaining. Schedule your showing today!
Pending
$169,900
3087 Huntington Dr, Columbus, OH 43207
3beds
1,296sqft
Single Family Residence
Built in 1960
7,840 Square Feet Lot
$-- Zestimate®
$131/sqft
$-- HOA
What's special
- 30 days
- 820
- 108
Likely to sell faster than
Zillow last checked:
Listing updated:
Listed by:
Kelly Rich 336-953-3953,
Mainstay Brokerage LLC
Source: Columbus and Central Ohio Regional MLS ,MLS#: 226038831
Facts & features
Interior
Bedrooms & bathrooms
- Bedrooms: 3
- Bathrooms: 2
- Full bathrooms: 2
- Main level bedrooms: 3
Heating
- Forced Air
Features
- Common walls with other units/homes: No Common Walls
Interior area
- Total structure area: 1,296
- Total interior livable area: 1,296 sqft
Property
Parking
- Parking features: Shared Driveway
- Has uncovered spaces: Yes
Features
- Levels: One
- Fencing: Fenced
Lot
- Size: 7,840 Square Feet
Details
- Additional structures: Shed(s)
- Parcel number: 010125324
Construction
Type & style
- Home type: SingleFamily
- Architectural style: Ranch
- Property subtype: Single Family Residence
Materials
- Foundation: Slab
Condition
- New construction: No
- Year built: 1960
Utilities & green energy
- Sewer: Public Sewer
- Water: Public
Community & HOA
Community
- Subdivision: Southfield/Marion Franklin
HOA
- Has HOA: No
Location
- Region: Columbus
Financial & listing details
- Price per square foot: $131/sqft
- Tax assessed value: $135,700
- Annual tax amount: $2,184
- Date on market: 10/13/2026
Estimated market value
Not available
Estimated sales range
Not available
Not available
Price history
| Date | Event | Price |
|---|---|---|
| 10/28/2026 | Pending sale | $169,900$131/sqft |
Source:  Columbus and Central Ohio Regional MLS #226038831 Report a problem | ||
| 10/13/2026 | Listed for sale | $169,900+61.8%$131/sqft |
Source: Columbus and Central Ohio Regional MLS #226038831 Report a problem | ||
| 8/29/2026 | Listing removed | $1,780$1/sqft |
Source: Zillow Rentals Report a problem | ||
| 8/26/2026 | Price change | $1,780-5.3%$1/sqft |
Source: Zillow Rentals Report a problem | ||
| 7/13/2026 | Listed for rent | $1,880+36.7%$1/sqft |
Source: Zillow Rentals Report a problem | ||
| 7/23/2023 | Listing removed | -- |
Source: Zillow Rentals Report a problem | ||
| 7/17/2023 | Listed for rent | $1,375+12.2%$1/sqft |
Source: Zillow Rentals Report a problem | ||
| 8/23/2021 | Sold | $105,000$81/sqft |
Source: Public Record Report a problem | ||
| 4/22/2021 | Listing removed | -- |
Source: Zillow Rental Network Premium Report a problem | ||
| 4/20/2021 | Price change | $1,225+2.1%$1/sqft |
Source: Zillow Rental Network Premium Report a problem | ||
| 4/7/2021 | Listed for rent | $1,200$1/sqft |
Source: Zillow Rental Network Premium Report a problem | ||
| 2/22/2021 | Sold | $105,000+5%$81/sqft |
Source: Columbus and Central Ohio Regional MLS #221002335 Report a problem | ||
| 1/30/2021 | Pending sale | $100,000$77/sqft |
Source: Columbus and Central Ohio Regional MLS #221002335 Report a problem | ||
| 1/26/2021 | Listed for sale | $100,000+185.7%$77/sqft |
Source: Columbus and Central Ohio Regional MLS #221002335 Report a problem | ||
| 8/22/2019 | Sold | $35,000+150%$27/sqft |
Source: Public Record Report a problem | ||
| 10/26/2011 | Sold | $14,000-19.3%$11/sqft |
Source: Public Record Report a problem | ||
| 9/10/2011 | Price change | $17,340-27.8%$13/sqft |
Source: Fannie Mae #211031768 Report a problem | ||
| 9/9/2011 | Listed for sale | -- |
Source: foreclosure.com Report a problem | ||
| 5/27/2010 | Sold | $24,000-66.5%$19/sqft |
Source: Public Record Report a problem | ||
| 9/27/2006 | Sold | $71,700+67.7%$55/sqft |
Source: Public Record Report a problem | ||
| 3/24/2005 | Sold | $42,744$33/sqft |
Source: Public Record Report a problem | ||
Public tax history
| Year | Property taxes | Tax assessment |
|---|---|---|
| 2025 | $2,184 +0.3% | $47,500 |
| 2024 | $2,177 +1.3% | $47,500 |
| 2023 | $2,150 +146.8% | $47,500 +189.8% |
| 2022 | $871 +33.5% | $16,390 +33.7% |
| 2021 | $653 -47.3% | $12,260 -47.3% |
| 2020 | $1,240 -0.1% | $23,250 +16.5% |
| 2019 | $1,241 +0.2% | $19,950 |
| 2018 | $1,238 | $19,950 |
| 2017 | $1,238 -8.4% | $19,950 +0.3% |
| 2016 | $1,351 +9.8% | $19,890 |
| 2015 | $1,230 | $19,890 |
| 2014 | $1,230 +102.4% | $19,890 +0.1% |
| 2013 | $608 -48.9% | $19,880 |
| 2011 | $1,189 -16.8% | $19,880 -20.8% |
| 2010 | $1,429 +2.6% | $25,095 |
| 2008 | $1,393 +23.1% | $25,095 |
| 2007 | $1,131 +0.4% | -- |
| 2006 | $1,127 -22.4% | -- |
| 2005 | $1,452 +25.4% | -- |
| 2004 | $1,158 -1.3% | -- |
| 2003 | $1,173 +39.7% | -- |
| 2002 | $839 +8.5% | -- |
| 2001 | $774 -0.5% | -- |
| 2000 | $777 | -- |
Find assessor info on the county website
Monthly payment
Est. payment
Payment breakdown
Explore the cost of this home by adjusting the details. Changes won't be saved.Climate risks
Neighborhood: Marion Franklin


Similar homes
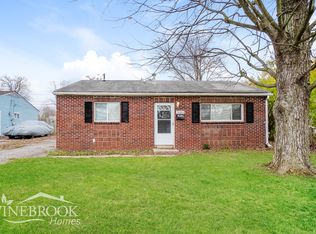
- $179,9003 bd1 ba938 sqft1304 Yolanda Dr, Columbus, OH 43207For Sale
 MLS ID #226041920, James E Ross, Red 1 Realty. Columbus and Central Ohio Regional MLS
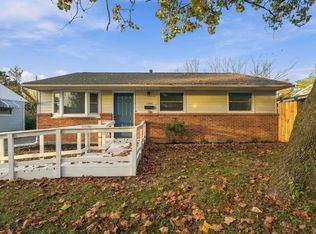
- $199,9993 bd2 ba1.1k sqft904 Reeb Ave, Columbus, OH 43207For Sale
 MLS ID #226037078, Donald A Payne, Vision Realty, Inc.. Columbus and Central Ohio Regional MLS
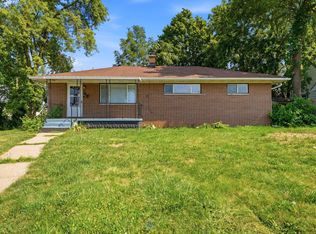
- $198,0003 bd1 ba936 sqft516 Harland Dr, Columbus, OH 43207For Sale
 MLS ID #226037513, Jennifer Kessel-White, KW Classic Properties Realty. Columbus and Central Ohio Regional MLS
- $204,9003 bd1 ba988 sqft691 Basswood Rd, Columbus, OH 43207For Sale
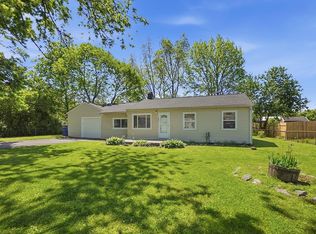 MLS ID #226023941, Brandon Kidd, Howard Hanna Real Estate Svcs. Columbus and Central Ohio Regional MLS
- $198,0003 bd1 ba896 sqft890 Bruckner Rd, Columbus, OH 43207For SaleMLS ID #226023571, Loree L Rupe, e-Merge Real Estate. Columbus and Central Ohio Regional MLS
- $194,9003 bd2 ba1.1k sqft490 E Markison Ave, Columbus, OH 43207For SaleMLS ID #226030011, Eva Marie Hockenberry, Mainstay Brokerage LLC. Columbus and Central Ohio Regional MLS
- $214,9003 bd2 ba1.4k sqft1575 S Champion Ave, Columbus, OH 43207For SaleMLS ID #226033785, Julia A Hupp, Red 1 Realty. Columbus and Central Ohio Regional MLS
- $229,0003 bd2 ba1.2k sqft4027 Judson Rd, Columbus, OH 43207For SaleMLS ID #226028651, Brian C Bainbridge, CRT, Realtors. Columbus and Central Ohio Regional MLS
- $175,0002 bd1 ba792 sqft2441 Wynwood Ave, Columbus, OH 43223For SaleMLS ID #226041345, Tiffany Cornett, M3K Real Estate Network Inc.. Columbus and Central Ohio Regional MLS
- $230,0003 bd1 ba984 sqft2585 Millview Dr, Columbus, OH 43207For SaleMLS ID #226039495, Shaunna Joy Boatman, Red 1 Realty. Columbus and Central Ohio Regional MLS
- $229,0003 bd2 ba1.1k sqft238 Delray Rd, Columbus, OH 43207For SaleMLS ID #226034151, Brittany Conner, Coldwell Banker Realty. Columbus and Central Ohio Regional MLS
- $230,0003 bd2 ba1.2k sqft4068 Gallatin Dr, Columbus, OH 43207For SaleMLS ID #226040170, Stephanie M Menches, Red 1 Realty. Columbus and Central Ohio Regional MLS
- $159,9003 bd2 ba1.2k sqft346 S Wheatland Ave, Columbus, OH 43204For SaleMLS ID #226038058, Carlton A Churchill, Red 1 Realty. Columbus and Central Ohio Regional MLS
- $170,0004 bd1 ba1k sqft2155 Schenley Dr, Columbus, OH 43219For SaleMLS ID #226030383, Anthony L Amos, Reafco. Columbus and Central Ohio Regional MLS
- $169,9002 bd2 ba1k sqft425 Helen St, Columbus, OH 43223For SaleMLS ID #226041207, Kimberly A Kovacs, Coldwell Banker Realty. Columbus and Central Ohio Regional MLS
- $160,0002 bd3 ba1.2k sqft2422 Hardesty Dr S #S11, Columbus, OH 43204For SaleMLS ID #226041393, Nicholas A Wulf, Coldwell Banker Realty. Columbus and Central Ohio Regional MLS
- $224,5003 bd2 ba1.2k sqft2954 Ratify Blvd #145, Columbus, OH 43207For SaleMLS ID #226042021, Justin M Hazley, Red 1 Realty. Columbus and Central Ohio Regional MLS
- $240,0004 bd2 ba1.3k sqft990 Reeb Ave, Columbus, OH 43207For SaleMLS ID #226033483, Theresa A Lawson, e-Merge Real Estate Unlimited. Columbus and Central Ohio Regional MLS
- $229,0003 bd1 ba1k sqft4242 Ethel Rd, Obetz, OH 43207For SaleMLS ID #226039853, Charles Scheiderer, Roby Realty. Columbus and Central Ohio Regional MLS
- $199,9003 bd1 ba1.1k sqft1209 Woodnell Ave, Columbus, OH 43219For SaleMLS ID #226041359, Abigail E Swihart Valentine, Red 1 Realty. Columbus and Central Ohio Regional MLS
