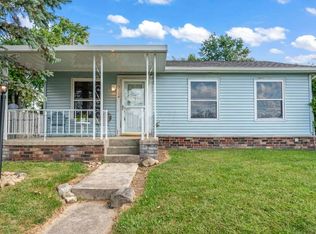
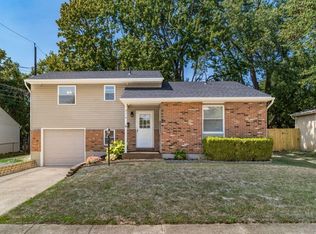
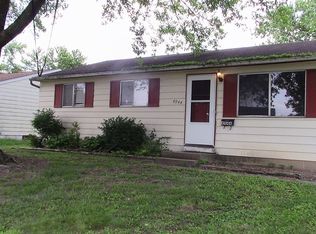
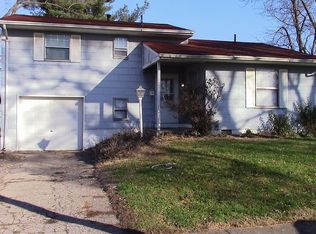
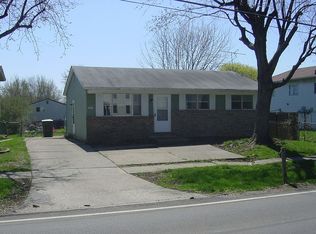
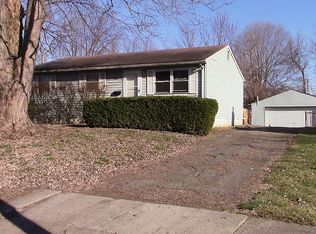
3 Bedrooom Bi Level, Large Eat In Kitchen, Living Room, Lower Level Family Room with Wet Bar, Long Driveway going into Large Fenced Back Yard. Close to Park, Shopping, Schools, Freeways, Groveport Madison School District
Curb offers only!! No flippers please!
For sale by owner
$150,000
3108 Noe Bixby Rd, Columbus, OH 43232
3beds
1,320sqft
SingleFamily
Built in 1967
8,308 Square Feet Lot
$-- Zestimate®
$114/sqft
$-- HOA
What's special
Long drivewayLarge eat in kitchen
- 279 days |
- 126 |
- 10 |
Listed by:
Property Owner (614) 231-7750
Facts & features
Interior
Bedrooms & bathrooms
- Bedrooms: 3
- Bathrooms: 1
- Full bathrooms: 1
Heating
- Forced air, Other
Cooling
- None
Appliances
- Included: Dishwasher, Garbage disposal
- Laundry: In Unit
Features
- Basement: Finished
- Has fireplace: Yes
Interior area
- Total interior livable area: 1,320 sqft
Property
Parking
- Parking features: Off-street
Features
- Exterior features: Other, Wood
Lot
- Size: 8,308 Square Feet
Details
- Parcel number: 18000472400
Construction
Type & style
- Home type: SingleFamily
Materials
- Wood
Condition
- New construction: No
- Year built: 1967
Community & HOA
Location
- Region: Columbus
Financial & listing details
- Price per square foot: $114/sqft
- Tax assessed value: $151,400
- Annual tax amount: $2,613
- Date on market: 9/23/2025
Estimated market value
Not available
Estimated sales range
Not available
$1,881/mo
Price history
| Date | Event | Price |
|---|---|---|
| 6/16/2026 | Listed for sale | $150,000-14.3%$114/sqft |
Source: Owner Report a problem | ||
| 6/1/2026 | Listing removed | -- |
Source: Owner Report a problem | ||
| 3/3/2026 | Price change | $175,000+6.1%$133/sqft |
Source: Owner Report a problem | ||
| 2/2/2026 | Price change | $165,000-5.7%$125/sqft |
Source: Owner Report a problem | ||
| 12/31/2025 | Listed for sale | $175,000$133/sqft |
Source: Owner Report a problem | ||
| 12/22/2025 | Listing removed | -- |
Source: Owner Report a problem | ||
| 9/23/2025 | Listed for sale | $175,000$133/sqft |
Source: Owner Report a problem | ||
| 1/14/2021 | Listing removed | -- |
Source: Zillow Rental Manager Report a problem | ||
| 12/4/2020 | Listed for rent | $1,095+10.1%$1/sqft |
Source: Columbus Best Rentals Report a problem | ||
| 1/17/2020 | Listing removed | $995$1/sqft |
Source: Columbus Best Rentals Report a problem | ||
| 12/17/2019 | Price change | $995+11.2%$1/sqft |
Source: Zillow Rental Manager Report a problem | ||
| 10/28/2019 | Price change | $895-5.3%$1/sqft |
Source: Zillow Rental Manager Report a problem | ||
| 9/26/2019 | Price change | $945-5%$1/sqft |
Source: Tiger Realty/Columbus Best Rentals Report a problem | ||
| 9/24/2019 | Listed for rent | $995+17.8%$1/sqft |
Source: Tiger Realty/Columbus Best Rentals Report a problem | ||
| 8/2/2016 | Listing removed | $845+9%$1/sqft |
Source: Best Rentals Report a problem | ||
| 7/14/2012 | Listing removed | $775$1/sqft |
Source: Tiger Realty Report a problem | ||
| 6/14/2012 | Listed for rent | $775+3.3%$1/sqft |
Source: Tiger Realty Report a problem | ||
| 12/30/2011 | Listing removed | $750$1/sqft |
Source: Barnett Realty Report a problem | ||
| 11/30/2011 | Listed for rent | $750$1/sqft |
Source: Barnett Realty Report a problem | ||
Public tax history
| Year | Property taxes | Tax assessment |
|---|---|---|
| 2024 | $2,613 +0.9% | $53,000 |
| 2023 | $2,590 +74.5% | $53,000 +119.4% |
| 2022 | $1,484 -0.4% | $24,160 |
| 2021 | $1,490 -0.3% | $24,160 |
| 2020 | $1,493 +1.2% | $24,160 +15% |
| 2019 | $1,475 -4.1% | $21,000 |
| 2018 | $1,538 | $21,000 -21.1% |
| 2017 | $1,538 +17.2% | $26,600 +58.2% |
| 2016 | $1,312 -4.2% | $16,810 |
| 2015 | $1,370 | $16,810 |
| 2014 | $1,370 +63.9% | $16,810 -34.7% |
| 2013 | $836 -48.9% | $25,725 |
| 2011 | $1,637 -14.7% | $25,725 -22.6% |
| 2010 | $1,918 +13.7% | $33,215 |
| 2008 | $1,687 +3.1% | $33,215 |
| 2007 | $1,637 +0.1% | -- |
| 2006 | $1,635 +2% | -- |
| 2005 | $1,604 +4.8% | -- |
| 2004 | $1,530 +0.4% | -- |
| 2003 | $1,523 -0.4% | -- |
| 2002 | $1,530 +7.6% | -- |
| 2001 | $1,422 -2% | -- |
| 2000 | $1,451 | -- |
Find assessor info on the county website
Monthly payment
Est. payment$--/mo
Payment breakdown
Explore the cost of this home by adjusting the details. Changes won't be saved.All calculations are estimates and provided by Zillow, Inc. for informational purposes only. Actual amounts may vary.
HOA fees may include property taxes on listings classified as Co-Ops. Contact the listing agent and/or owner for fee details.
Mortgage interest rates are dependent on a number of factors, including credit score, down payment, and repayment length. Interest rate data provided by Zillow Group Marketplace, Inc. as of 1/1/1970 from various mortgage lenders with which we have lead or other similar arrangements; the Estimated Payment is an average of those rates.
See how much you could borrow to make a competitive offer.
Climate risks
Neighborhood: 43232
Nearby schools
GreatSchools rating
- 6/10Sedalia Elementary SchoolGrades: K-5Distance: 0.6 mi
- 5/10Groveport Madison Middle School SouthGrades: 6-8Distance: 4 mi
- 4/10Groveport Madison High SchoolGrades: 9-12Distance: 2.7 mi
A local agent can set up tours, give advice and negotiate with sellers.
A local lender can help you make sure your offer is ready when you are.

- Ohio
- Franklin County
- Blacklick Estates
- 43232
- 3108 Noe Bixby Rd
Nearby cities
Nearby zip codes
Other Blacklick Estates Topics
- Apartments for Rent in 43232
- Houses for Sale in 43232
- Houses for Rent in 43232
- 43232 Real Estate
- Blacklick Estates Condos
- Houses for Sale in Blacklick Estates
- Newest Listings in Blacklick Estates
- Blacklick Estates Home Values
- Blacklick Estates Real Estate Agents
- Blacklick Estates Refinance
- Blacklick Estates Mortgage Rates
