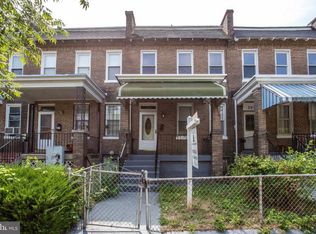
311 Bryant St NE, Washington, DC 20002 is a single family home that contains 1,356 sq ft and was built in 1925. It contains 4 bedrooms and 3 bathrooms. This home last sold for $179,428 in June 2025.
The Zestimate for this house is $625,800. The Rent Zestimate for this home is $4,863/mo.
Sold for $179,428
$179,428
311 Bryant St NE, Washington, DC 20002
4beds
3baths
1,356sqft
SingleFamily
Built in 1925
1,612 Square Feet Lot
$625,800 Zestimate®
$132/sqft
$4,863 Estimated rent
Home value
$625,800
$569,000 - $682,000
$4,863/mo
Zestimate® history
Owner options
List your home for rent
$4,863/mo
Rent Zestimate®
Find your next renter with Zillow Rental Manager. Plus, with online applications, you can quickly screen prospective tenants – for free.
$4,863/mo
Rent Zestimate®
Refinance and save
$856/mo
Est. payment
Refinancing to a lower rate could help reduce your monthly payments and save thousands over the life of the loan.
$856/mo
Est. payment
Explore your selling options
Work with a Zillow partner agent
Leverage their expertise and Zillow's premium Showcase listings to get your home seen by more buyers.
Get startedList with your own agent
Get your home in front of millions of buyers by listing it on Zillow.
Learn how to do itSell it yourself
Take full control of how buyers see your home on Zillow by listing For Sale by Owner (FSBO).
List your homeWhat's special
Facts & features
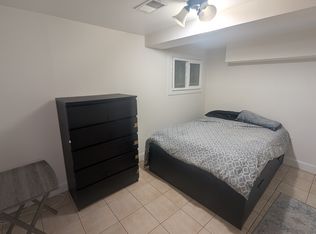
Interior
Bedrooms & bathrooms
- Bedrooms: 4
- Bathrooms: 3
Heating
- Forced air, Other
Cooling
- Other
Appliances
- Included: Dryer, Washer
- Laundry: In Unit
Features
- Flooring: Hardwood
- Basement: Finished
Interior area
- Total interior livable area: 1,356 sqft
Property
Parking
- Parking features: None
Features
- Exterior features: Brick
Lot
- Size: 1,612 sqft
Details
- Parcel number: 35580088
Construction
Type & style
- Home type: SingleFamily
Materials
- Roof: Other
Condition
- Year built: 1925
Community & neighborhood
Location
- Region: Washington
Other
Other facts
- Cooling System: Air Conditioning
- Laundry: In Unit
Price history
| Date | Event | Price |
|---|---|---|
| 6/11/2025 | Sold | $179,428+49.5%$132/sqft |
Source: Public Record Report a problem | ||
| 5/2/2024 | Listing removed | -- |
Source: Bright MLS #DCDC2126074 Report a problem | ||
| 1/30/2024 | Listed for rent | $1,350-61.4%$1/sqft |
Source: Bright MLS #DCDC2126074 Report a problem | ||
| 7/17/2023 | Listing removed | -- |
Source: Zillow Rentals Report a problem | ||
| 4/24/2023 | Listed for rent | $3,500+6.1%$3/sqft |
Source: Zillow Rentals Report a problem | ||
| 9/17/2019 | Listing removed | $3,300$2/sqft |
Source: Zillow Rental Manager Report a problem | ||
| 8/17/2019 | Price change | $3,300-5.7%$2/sqft |
Source: Zillow Rental Manager Report a problem | ||
| 7/30/2019 | Price change | $3,500+118.8%$3/sqft |
Source: Zillow Rental Manager Report a problem | ||
| 7/16/2019 | Listed for rent | $1,600+14.3%$1/sqft |
Source: Zillow Rental Manager Report a problem | ||
| 5/25/2018 | Listing removed | $1,400$1/sqft |
Source: Zillow Rental Manager Report a problem | ||
| 3/29/2018 | Listed for rent | $1,400-53.3%$1/sqft |
Source: Zillow Rental Manager Report a problem | ||
| 9/8/2017 | Listing removed | $3,000$2/sqft |
Source: Upper Marlboro #DC10024743 Report a problem | ||
| 8/7/2017 | Listed for rent | $3,000-14.3%$2/sqft |
Source: Upper Marlboro #DC10024743 Report a problem | ||
| 8/30/2016 | Listing removed | $3,500+9.4%$3/sqft |
Source: RE/MAX SKY REAL ESTATE #DC9711669 Report a problem | ||
| 4/27/2016 | Listing removed | $3,200$2/sqft |
Source: RE/MAX SKY REAL ESTATE #DC9561471 Report a problem | ||
| 2/1/2016 | Listed for rent | $3,200$2/sqft |
Source: RE/MAX Sky Real Estate #DC9561471 Report a problem | ||
| 5/12/2004 | Sold | $120,000$88/sqft |
Source: Public Record Report a problem | ||
Public tax history
| Year | Property taxes | Tax assessment |
|---|---|---|
| 2025 | $4,920 +2.7% | $578,800 +2.7% |
| 2024 | $4,788 +3.7% | $563,330 +3.7% |
| 2023 | $4,617 +9% | $543,200 +9% |
| 2022 | $4,237 +2.8% | $498,490 +2.8% |
| 2021 | $4,123 +3.2% | $485,020 +3.2% |
| 2020 | $3,994 +9.4% | $469,900 +9.4% |
| 2018 | $3,650 +8% | $429,440 +8% |
| 2017 | $3,380 +7.9% | $397,700 +7.9% |
| 2016 | $3,134 +9.5% | $368,700 +9.5% |
| 2015 | $2,863 +23.6% | $336,860 +23.7% |
| 2014 | $2,316 +1.6% | $272,430 +1.6% |
| 2013 | $2,280 +3.3% | $268,250 +3.3% |
| 2012 | $2,207 | $259,660 |
| 2011 | $2,207 -10.5% | $259,660 -10.5% |
| 2010 | $2,466 -9.9% | $290,090 -9.9% |
| 2009 | $2,736 +9.5% | $321,900 +13.4% |
| 2007 | $2,498 +22.1% | $283,910 +27.6% |
| 2006 | $2,047 +18.5% | $222,460 +23.6% |
| 2005 | $1,728 +359.2% | $179,980 +20% |
| 2004 | $376 +12% | $149,980 +50% |
| 2003 | $336 +2.9% | $99,989 +2% |
| 2002 | $326 +3% | $98,014 +2.1% |
| 2001 | $317 | $96,038 |
Find assessor info on the county website
Neighborhood: Edgewood
Nearby schools
GreatSchools rating
- 2/10Langley Elementary SchoolGrades: PK-5Distance: 0.5 mi
- 4/10McKinley Middle SchoolGrades: 6-8Distance: 0.5 mi
- 3/10Dunbar High SchoolGrades: 9-12Distance: 1.1 mi
Get a cash offer in 3 minutes
Find out how much your home could sell for in as little as 3 minutes with a no-obligation cash offer.
Estimated market value
$625,800
Get a cash offer in 3 minutes
Find out how much your home could sell for in as little as 3 minutes with a no-obligation cash offer.
Estimated market value
$625,800
- Washington, DC
- District of Columbia
- Washington
- 20002
- Edgewood
- 311 Bryant St NE
Nearby cities
Nearby neighborhoods
Nearby zip codes
Other Washington Topics
