An exceptional investment opportunity awaits in Jacksonville! Located at 3131 Dignan Street, this property offers incredible potential for savvy investors, flippers, or buyers looking to build sweat equity. Situated in a conveniently located neighborhood with easy access to major roadways, downtown Jacksonville, dining, shopping, and local parks, the location provides fantastic connectivity throughout the city. The home is being sold strictly AS-IS, presenting a blank canvas ready for your vision, updates, and personal touch. Whether you are seeking your next renovation project, a profitable add to your rental portfolio, or a value-add primary residence, the possibilities here are endless. Bring your contractor, bring your creative vision, and unlock the true potential of this property. Opportunities at this price point do not last long—schedule your showing today and capitalize on this remarkable potential!
Active
$180,000
3131 DIGNAN Street, Jacksonville, FL 32254
3beds
792sqft
Single Family Residence
Built in 1949
6,969 Square Feet Lot
$176,100 Zestimate®
$227/sqft
$-- HOA
What's special
- 26 days
- 195
- 3
Zillow last checked:
Listing updated:
Listed by:
NANCY LEHMBECK 904-535-7538,
JWB REALTY LLC 904-737-0035
Source: realMLS,MLS#: 2166809
Facts & features
Interior
Bedrooms & bathrooms
- Bedrooms: 3
- Bathrooms: 2
- Full bathrooms: 2
Heating
- Central, Electric
Cooling
- Central Air, Electric
Appliances
- Included: Other
Interior area
- Total interior livable area: 792 sqft
Property
Parking
- Parking features: Other
Features
- Levels: One
- Stories: 1
Lot
- Size: 6,969 Square Feet
- Features: Other
Details
- Parcel number: 0573410000
Construction
Type & style
- Home type: SingleFamily
- Architectural style: Other
- Property subtype: Single Family Residence
Condition
- Fixer
- New construction: No
- Year built: 1949
Utilities & green energy
- Sewer: Public Sewer
- Water: Public
- Utilities for property: Cable Available
Community & HOA
Community
- Subdivision: Paxon
HOA
- Has HOA: No
Location
- Region: Jacksonville
Financial & listing details
- Price per square foot: $227/sqft
- Tax assessed value: $119,450
- Annual tax amount: $2,473
- Date on market: 9/28/2026
- Listing terms: Cash
Estimated market value
$176,100
$167,000 - $185,000
$1,355/mo
Price history
| Date | Event | Price |
|---|---|---|
| 9/28/2026 | Listed for sale | $180,000-14.3%$227/sqft |
Source:  realMLS #2166809 Report a problem | ||
| 5/13/2026 | Listing removed | $210,000$265/sqft |
Source: realMLS #2124959 Report a problem | ||
| 4/8/2026 | Price change | $210,000-4.5%$265/sqft |
Source: realMLS #2124959 Report a problem | ||
| 1/13/2026 | Listed for sale | $220,000$278/sqft |
Source: realMLS #2124959 Report a problem | ||
| 11/13/2025 | Listing removed | $220,000$278/sqft |
Source: realMLS #2102729 Report a problem | ||
| 8/7/2025 | Listed for sale | $220,000+100%$278/sqft |
Source: realMLS #2102729 Report a problem | ||
| 10/24/2020 | Sold | $110,000$139/sqft |
Source: realMLS #1075831 Report a problem | ||
| 10/1/2020 | Pending sale | $110,000$139/sqft |
Source: EXIT REAL ESTATE GALLERY #1075831 Report a problem | ||
| 10/1/2020 | Listed for sale | $110,000+388.9%$139/sqft |
Source: EXIT REAL ESTATE GALLERY #1075831 Report a problem | ||
| 7/16/2020 | Listing removed | $825$1/sqft |
Source: JWB Rental Homes Report a problem | ||
| 7/7/2020 | Listed for rent | $825$1/sqft |
Source: Zillow Rental Network Premium Report a problem | ||
| 2/21/2018 | Sold | $22,500-51.9%$28/sqft |
Source: Public Record Report a problem | ||
| 5/9/2008 | Sold | $46,800-37.6%$59/sqft |
Source: Public Record Report a problem | ||
| 12/8/2004 | Sold | $75,000+105.5%$95/sqft |
Source: Public Record Report a problem | ||
| 7/26/2004 | Sold | $36,500-42.1%$46/sqft |
Source: Public Record Report a problem | ||
| 9/19/2002 | Sold | $63,000+1160%$80/sqft |
Source: Public Record Report a problem | ||
| 4/17/2002 | Sold | $5,000$6/sqft |
Source: Public Record Report a problem | ||
Public tax history
| Year | Property taxes | Tax assessment |
|---|---|---|
| 2025 | $2,473 +14.4% | $119,450 +7.8% |
| 2024 | $2,161 +10.9% | $110,795 +12.6% |
| 2023 | $1,949 +8.9% | $98,405 +4.3% |
| 2022 | $1,789 +30.5% | $94,383 +38.9% |
| 2021 | $1,371 +98.4% | $67,948 +134.9% |
| 2020 | $691 +2.2% | $28,926 +4.5% |
| 2019 | $676 +55.5% | $27,688 +151.4% |
| 2018 | $435 | $11,013 -42.6% |
| 2017 | $435 +2.6% | $19,184 -1.5% |
| 2016 | $424 +0.6% | $19,476 +5.9% |
| 2015 | $421 -20.4% | $18,399 -6.9% |
| 2014 | $529 | $19,758 +5.7% |
| 2013 | -- | $18,686 -26.2% |
| 2012 | -- | $25,322 -43.5% |
| 2011 | -- | $44,782 -7.4% |
| 2010 | -- | $48,381 -8.2% |
| 2009 | -- | $52,702 -20.2% |
| 2006 | -- | $66,053 +8.6% |
| 2005 | $1,130 | $60,830 +11.7% |
| 2004 | -- | $54,438 +1.9% |
| 2003 | $551 | $53,438 +688.4% |
| 2002 | -- | $6,778 -10.6% |
| 2001 | -- | $7,578 +1.3% |
| 2000 | -- | $7,478 |
| 1999 | -- | $7,478 |
Find assessor info on the county website
Monthly payment
Est. payment
Payment breakdown
Explore the cost of this home by adjusting the details. Changes won't be saved.Climate risks
Neighborhood: Lackawanna


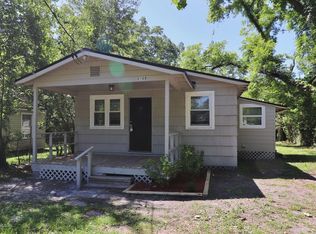
Similar homes
- $177,5005 bd2 ba1k sqft3040 W 5TH Street, Jacksonville, FL 32254For Sale
 MLS ID #2152970, HANNAH SHEEHAN. realMLS
- $175,0003 bd2 ba1.1k sqft2509 WYLENE Street, Jacksonville, FL 32209For Sale
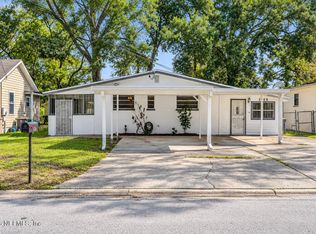 MLS ID #2167783, ALINA PENJIYEVA. realMLS
- $159,9003 bd2 ba1k sqft2120 N DAVIS Street, Jacksonville, FL 32209For Sale
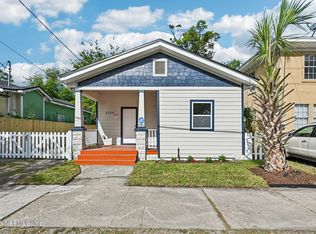 MLS ID #2170253, ERIN E KING. realMLS
- $179,0002 bd1 ba784 sqft3513 COLLEGE Street, Jacksonville, FL 32205For Sale
 MLS ID #2147349, HELEN M JONES. realMLS
