"PIER PRESSURE" Permitted for 6 residents. Outstanding investment property centrally located adjacent to Miami University in Barstool Sports' "BEST COLLEGE TOWN." **Leased 26-27 for $39,500. Leased for 27-28 for $41,000. New Kitchen & Appliances 2025. Screened in patio. Huge Lot for recreation. Excellent rental history. Close to Uptown, Millet, Campus, and Fraternity Row.
For sale
$475,000
317 N Beech St, Oxford, OH 45056
3beds
--baths
1,291sqft
Multi Family
Built in 1915
-- sqft lot
$-- Zestimate®
$368/sqft
$-- HOA
What's special
Huge lot for recreationScreened in patio
- 200 days
- 127
- 6
Zillow last checked:
Listing updated:
Listed by:
Matthew C Rodbro 513-257-7237,
Plum Tree Realty 513-443-5060
Source: Cincy MLS,MLS#: 1876382 Originating MLS: Cincinnati Area Multiple Listing Service
Facts & features
Interior
Bedrooms & bathrooms
- Bedrooms: 3
Heating
- Forced Air
Cooling
- Central Air
Features
- Windows: Vinyl
- Basement: Partial
- Has fireplace: No
- Fireplace features: None
Interior area
- Total structure area: 1,291
- Total interior livable area: 1,291 sqft
Property
Parking
- Total spaces: 2
- Parking features: Concrete, Driveway
- Uncovered spaces: 2
Features
- Levels: Two
- Stories: 2
Lot
- Size: 10,454 Square Feet
Details
- Parcel number: H4100007000004
Construction
Type & style
- Home type: MultiFamily
- Property subtype: Multi Family
Materials
- Vinyl Siding
- Foundation: Concrete Perimeter
- Roof: Composition
Condition
- New construction: No
- Year built: 1915
Utilities & green energy
- Gas: Natural
- Sewer: Public Sewer
- Water: Public
Community & HOA
Location
- Region: Oxford
Financial & listing details
- Price per square foot: $368/sqft
- Tax assessed value: $175,000
- Annual tax amount: $3,820
- Date on market: 4/24/2026
- Listing terms: No Special Financing
Estimated market value
Not available
Estimated sales range
Not available
Not available
Price history
| Date | Event | Price |
|---|---|---|
| 4/24/2026 | Listed for sale | $475,000-4.8%$368/sqft |
Source:  Cincy MLS #1876382 Report a problem | ||
| 3/19/2026 | Listing removed | $499,000$387/sqft |
Source: Cincy MLS #1855575 Report a problem | ||
| 9/19/2025 | Listed for sale | $499,000+185.1%$387/sqft |
Source: Cincy MLS #1855575 Report a problem | ||
| 11/5/2020 | Sold | $175,000$136/sqft |
Source: Public Record Report a problem | ||
Public tax history
| Year | Property taxes | Tax assessment |
|---|---|---|
| 2025 | $3,820 +0.4% | $61,250 |
| 2024 | $3,806 +5.1% | $61,250 |
| 2023 | $3,623 -5.9% | $61,250 |
| 2022 | $3,852 | $61,250 |
| 2021 | -- | $61,250 -6.1% |
| 2020 | $2,588 +12.4% | $65,220 +18.3% |
| 2019 | $2,303 -0.1% | $55,110 |
| 2018 | $2,306 +11% | $55,110 |
| 2017 | $2,077 +2.1% | $55,110 +5.6% |
| 2016 | $2,034 -1.7% | $52,210 |
| 2015 | $2,069 -5.7% | $52,210 |
| 2014 | $2,194 | $52,210 -4% |
| 2013 | $2,194 -0.2% | $54,370 |
| 2012 | $2,198 | $54,370 +0% |
| 2011 | $2,198 -5.9% | $54,366 -25.2% |
| 2010 | $2,335 +3% | $72,664 |
| 2009 | $2,267 +1.7% | $72,664 -1% |
| 2008 | $2,230 +60.1% | $73,385 +81.8% |
| 2007 | $1,393 -1.4% | $40,356 +0% |
| 2006 | $1,412 +3.9% | $40,345 |
| 2005 | $1,359 +17.5% | $40,345 +23% |
| 2004 | $1,157 +1.4% | $32,806 |
| 2003 | $1,141 +5.9% | $32,806 |
| 2002 | $1,078 +3.6% | $32,806 +11.5% |
| 2001 | $1,040 +1% | $29,432 |
| 2000 | $1,031 | $29,432 |
Find assessor info on the county website
Monthly payment
Est. payment
Payment breakdown
Explore the cost of this home by adjusting the details. Changes won't be saved.Climate risks
Neighborhood: 45056


Similar homes
- $389,9003 bd3 ba1.7k sqft15 Bull Run Dr, Oxford, OH 45056For Sale

 MLS ID #1899743, Melissa B. Friede, Keller Williams Seven Hills Re. Cincy MLS
- $410,0004 bd3 ba1.6k sqft103 Linnwood Ln, Oxford, OH 45056For Sale
 MLS ID #1899311, Melissa B. Friede, Keller Williams Seven Hills Re. Cincy MLS
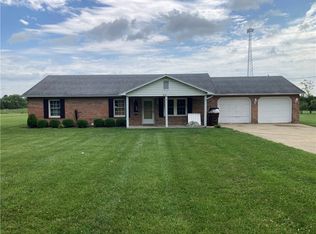
- $540,0003 bd2 ba1.5k sqft3856 Kehr Rd, Oxford, OH 45056For Sale
 MLS ID #964900, Peter McCarthy, Coldwell Banker College Real E. DABR MLS
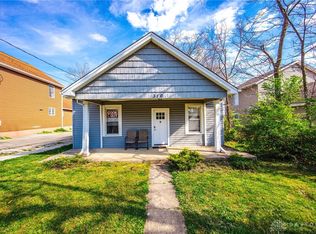
- $279,0004 bd3 ba1.4k sqft310 W Sycamore St, Oxford, OH 45056For Sale
 MLS ID #966549, Kelly Umbstead, Coldwell Banker College Real E. DABR MLS
- $399,9003 bd2 ba1.7k sqft2275 Trenton Oxford Rd, Oxford, OH 45056For SaleMLS ID #1891675, Jeffrey Boyle, Keller Williams Advisors. Cincy MLS
- $399,9003 bd2 ba1.7k sqft2275 Oxford Trenton Rd, Oxford, OH 45056For SaleMLS ID #967600, Jeffrey Boyle, Keller Williams Advisors Rlty. DABR MLS
- $285,0004 bd2 ba1.6k sqft5400 Hester Rd, Oxford, OH 45056For SaleMLS ID #971249, Melissa Bolser, Sibcy Cline, Inc.. DABR MLS
- $259,9002 bd2 ba1.8k sqft9 Chestnut Hill Dr, Oxford, OH 45056For SaleMLS ID #1899318, Noah Zipko, RE/MAX Incompass. Cincy MLS
- $450,0003 bd2 ba1.6k sqft10110 Crosby Rd, Harrison, OH 45030For SaleMLS ID #1899056, Margaret B. Killough, Keller Williams Seven Hills Re. Cincy MLS
- $425,0003 bd1 ba1.4k sqft9012 Free Short Pike, Camden, OH 45311For SaleMLS ID #965618, Christine Geisen, Keller Williams Seven Hills. DABR MLS
- $325,0003 bd2 ba1.2k sqft6692 Baker Rd, Somerville, OH 45064For SaleMLS ID #1898969, Donald Davis, Bowling & Kugler Realty. Cincy MLS
- $339,5003 bd2 ba1.2k sqft7943 Hamilton Scipio Rd, Okeana, OH 45053For SaleMLS ID #1877622, Karen K Rachford, OwnerLand Realty, Inc.. Cincy MLS
- $410,0003 bd3 ba1.7k sqft828 Miami Way Dr, Hamilton, OH 45013For SaleMLS ID #972217, Diana Dixon, Coldwell Banker Heritage. DABR MLS
- $299,9003 bd2 ba1.5k sqft3951 W Elkton Rd, Hamilton, OH 45011For SaleMLS ID #1898387, Zachary T. Deatherage, Keller Williams Seven Hills Re. Cincy MLS
- $329,9003 bd3 ba1.5k sqft3814 Cranberry Ct, Hamilton, OH 45011For SaleMLS ID #1899542, Kimberly A. Price, Plum Tree Realty. Cincy MLS
- $259,9004 bd2 ba1.4k sqft2471 Millville Oxford Rd, Hamilton, OH 45013For SaleMLS ID #1893748, Christina L. Hool, Century 21 Thacker & Assoc.. Cincy MLS
- $449,9003 bd2 ba1.7k sqft549 Chatham Pl, Trenton, OH 45067For SaleMLS ID #971530, Amanda Roberts, Plum Tree Realty. DABR MLS
- $299,0003 bd2 ba1.5k sqft799 Millville Oxford Rd, Hamilton, OH 45013For SaleMLS ID #1879606, David L. Fields, Martha Baker Realty, Inc. Cincy MLS
