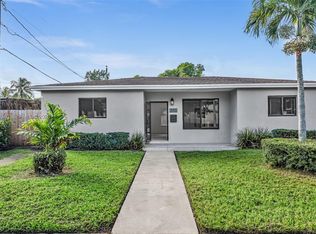
TURNKEY INVESTMENT OPPORTUNITY NEAR MIAMI SHORES! Beautifully renovated duplex featuring two spacious 2-bedroom, 1-bathroom units, each offering modern finishes, open-concept kitchens, tile flooring, and stylish furnishings throughout. Both units are sold fully furnished and equipped, making this a truly turnkey investment! Property features a newer roof, septic tank installed within the last five years, and 3 parking spaces per unit. Situated on a generous 7,500 sq. ft. lot with lush landscaping, mature fruit trees, and inviting front and back yards, perfect for outdoor relaxation. Currently operating as an active Airbnb business, this income-producing property offers an excellent opportunity for investors. Sale includes all furnishings and the existing rental operation, allowing for a smooth transition to the new owner, subject to applicable requirements. Ideally located just minutes from Miami Shores! Perfect for investors or buyers looking to live in one unit while generating income from the other. A rare opportunity to own a fully renovated, furnished, income-producing duplex in a desirable location!
For sale
$780,000
319 NE 110th Ter, Miami, FL 33161
4beds
2baths
1,482sqft
Duplex
Built in 1948
-- sqft lot
$746,400 Zestimate®
$526/sqft
$-- HOA
What's special
Modern finishesMature fruit treesBeautifully renovated duplexStylish furnishings throughoutOpen-concept kitchensNewer roofTile flooring
- 7 days
- 271
- 21
Likely to sell faster than
Zillow last checked:
Listing updated:
Listed by:
Daney Cabrera PA 305-606-5455,
Keller Williams Realty Premier Properties
Source: MIAMI,MLS#: A12117802 Originating MLS: A-Miami Association of REALTORS
Facts & features
Interior
Bedrooms & bathrooms
- Bedrooms: 4
- Bathrooms: 2
Heating
- Central, Electric
Cooling
- Central Air, Electric
Features
- Flooring: Ceramic Tile, Tile
- Doors: High Impact Doors
- Windows: Clear Impact Glass, Impact Glass
Interior area
- Total structure area: 1,594
- Total interior livable area: 1,482 sqft
Video & virtual tour
Property
Parking
- Total spaces: 6
Features
- Stories: 1
- Exterior features: Room For Pool
- Fencing: Fenced
Lot
- Features: Less Than 1/4 Acre Lot
- Residential vegetation: Fruit Trees
Details
- Parcel number: 3022310310290
- Zoning: 5700
Construction
Type & style
- Home type: MultiFamily
- Property subtype: Duplex
Materials
- CBS Construction
- Roof: Shingle
Condition
- Year built: 1948
Utilities & green energy
- Sewer: Septic Tank
- Water: Municipal Water
Community & HOA
Community
- Subdivision: Dixie View
HOA
- Has HOA: No
Location
- Region: Miami
Financial & listing details
- Price per square foot: $526/sqft
- Tax assessed value: $599,336
- Annual tax amount: $10,447
- Date on market: 11/3/2026
- Listing terms: All Cash,Conventional,FHA
Estimated market value
$746,400
$709,000 - $784,000
$3,484/mo
Price history
| Date | Event | Price |
|---|---|---|
| 11/4/2026 | Listed for sale | $780,000+56%$526/sqft |
Source:  MIAMI #A12117802 Report a problem | ||
| 2/15/2021 | Sold | $500,000-6.5%$337/sqft |
Source: MIAMI #A10930876 Report a problem | ||
| 12/25/2020 | Contingent | $535,000+7%$361/sqft |
Source:  MIAMI #A10930876 Report a problem | ||
| 12/1/2020 | Sold | $500,000-6.5%$337/sqft |
Source: Public Record Report a problem | ||
| 9/28/2020 | Pending sale | $535,000$361/sqft |
Source: Caba Real Estate #A10930876 Report a problem | ||
| 9/27/2020 | Contingent | $535,000$361/sqft |
Source: MIAMI #A10930876 Report a problem | ||
| 9/22/2020 | Listed for sale | $535,000+131.4%$361/sqft |
Source: Caba Real Estate #A10930876 Report a problem | ||
| 1/2/2019 | Sold | $231,200+5.1%$156/sqft |
Source: Public Record Report a problem | ||
| 11/26/2018 | Pending sale | $220,000$148/sqft |
Source: Continental Realtors LLC #A10557898 Report a problem | ||
| 11/14/2018 | Listed for sale | $220,000$148/sqft |
Source: Continental Realtors LLC #A10557898 Report a problem | ||
Public tax history
| Year | Property taxes | Tax assessment |
|---|---|---|
| 2025 | $10,447 +6.7% | $489,701 +10% |
| 2024 | $9,788 +12.5% | $445,183 +10% |
| 2023 | $8,699 +12% | $404,712 +10% |
| 2022 | $7,767 +12.8% | $367,920 +10% |
| 2021 | $6,884 +25.3% | $334,473 +31.3% |
| 2020 | $5,493 +4.5% | $254,725 +5.8% |
| 2019 | $5,257 +12.5% | $240,682 +18.6% |
| 2018 | $4,671 | $202,981 +50.1% |
| 2017 | $4,671 +72.5% | $135,273 +6.5% |
| 2016 | $2,708 +12.4% | $127,006 +5.7% |
| 2015 | $2,408 +4.9% | $120,171 +5.5% |
| 2014 | $2,296 -0.2% | $113,870 +4.5% |
| 2013 | $2,299 | $108,923 -5.1% |
| 2012 | $2,299 +0.4% | $114,781 +1.4% |
| 2011 | $2,291 -8.4% | $113,147 -4.2% |
| 2010 | $2,502 -22.5% | $118,095 |
| 2006 | $3,227 +16.1% | -- |
| 2004 | $2,779 +21.2% | -- |
| 2003 | $2,292 | -- |
Find assessor info on the county website
Monthly payment
Est. payment
Payment breakdown
Explore the cost of this home by adjusting the details. Changes won't be saved.Climate risks
Neighborhood: 33161


Similar homes
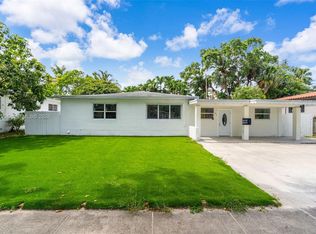
- $779,0003 bd2 ba1.2k sqftPanuleta Gardens, North Miami Beach, FL 33162For Sale
 MLS ID #A12120340, Ariel Shahaf, Miles Goldstein Real Estate. MIAMI
- $650,0004 bd3 ba1.6k sqftBreezeswept Estates, North Miami, FL 33161For Sale
 MLS ID #A11992204, Laura Cresto, Douglas Elliman. MIAMI
- $799,9995 bd4 ba1.9k sqftOverbrook Shores No-2, North Miami, FL 33168For Sale
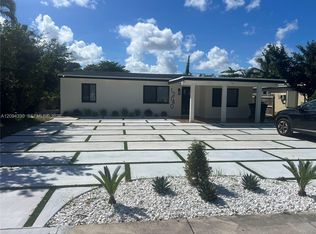 MLS ID #A12094330, Frantz Desir, The Moreno Property Group, LLC.. MIAMI
- $729,0004 bd3 ba1.8k sqftW Miami Shores Sec B, Miami, FL 33150For Sale
 MLS ID #A12090977, Juan Corzo, SOMOS Realty Corp. MIAMI
- $639,9006 bd3 ba1.7k sqftCommunity Gardens, Opa Locka, FL 33054For SaleMLS ID #A12100528, Juan Perez, Florida Realty of Miami Corp. MIAMI
- $815,0003 bd2 ba1.2k sqftTropical Ests, Miami, FL 33165For SaleMLS ID #A12119916, Melissa Gibbings PA, The Source Real Estate. MIAMI
- $560,0006 bd2 ba1.7k sqftRose Bower Amd Pl, Miami, FL 33150For SaleMLS ID #A12116288, Jeatiah Jean, Lifestyle International Realty. MIAMI
- $736,0003 bd2 ba1k sqftJillshar-Darrylcar, North Miami Beach, FL 33162For SaleMLS ID #A12089898, Jennifer Meyers, Douglas Elliman. MIAMI
- $674,9004 bd2 ba1.2k sqftGolden Highlands Est, Miami Gardens, FL 33054For SaleMLS ID #A12115789, Onelio Carmona, Carmona Real Estate Group LLC. MIAMI
- $749,0004 bd2 ba1.4k sqftCoral Pl Rev, Miami, FL 33133For SaleMLS ID #A12089882, Melissa Lorenzo, Lexan Real Estate, LLC. MIAMI
- $575,0002 bd3 ba1.3k sqftStephen Manor, Miami, FL 33150For SaleMLS ID #A12118942, Maria Fernanda Bustamante, Luxe Properties. MIAMI
- $615,0003 bd2 ba1.3k sqftW Miami Shores Sec B, Miami, FL 33150For SaleMLS ID #A12064284, Fabian Solis, Lifestyle International Realty. MIAMI
- $715,0006 bd3 ba2k sqftFairhaven Gardens, Miami, FL 33142For SaleMLS ID #A12106274, Ydalia Rodriguez, Related General Realty, LLC.. MIAMI
- $694,9004 bd2 ba1.6k sqft2nd Rev Pl Of Industrial, Hialeah, FL 33012For SaleMLS ID #A12108986, Jonatan Perez, American Homes By Design LLC. MIAMI
- $920,0004 bd3 ba1.6k sqftAlta Vista, Miami, FL 33127For SaleMLS ID #A12057382, Hugo Lopez Diaz, My Realty Group, LLC.. MIAMI
- $672,5004 bd4 ba2k sqftArcola Gardens, Miami, FL 33150For SaleMLS ID #A11768578, James Bunyan, Millennium III Realty Services. MIAMI
- $575,0003 bd2 ba1k sqftGregory Heights, North Miami, FL 33167For SaleMLS ID #A12090754, Dahiana Rojas de Rojas, Canvas Real Estate. MIAMI
- $480,0003 bd1 ba924 sqftBiscayne Highlands, North Miami, FL 33161For SaleMLS ID #A12097124, Gerald McHenry, First Service Realty ERA. MIAMI
- $625,0004 bd3 ba1.6k sqftEvergreen Gardens, Miami, FL 33142For SaleMLS ID #A12106049, Gregory Celentano, Union Street Partners, LLC. MIAMI
