3-bedroom, 2-bathroom home in Gulf Park Estates. High ceilings and a wood-burning fireplace in the living room. Large inside laundry room. Primary suite has a walk-in closet and sitting room. Fenced backyard. No flood insurance required. Ask your agent about a 100% financing USDA loan or assumable loan at 5.625% for qualified VA assumptions.
Active
$259,000
3221 N 3rd St, Ocean Springs, MS 39564
3beds
1,744sqft
Residential, Single Family Residence
Built in 1993
0.25 Acres Lot
$255,100 Zestimate®
$149/sqft
$-- HOA
What's special
High ceilingsLarge inside laundry roomFenced backyard
- 12 days
- 412
- 21
Likely to sell faster than
Zillow last checked:
Listing updated:
Listed by:
Laura M Bryan 228-861-4438,
Stars and Stripes Realty, LLC. 228-219-7653,
Taryn P Flynt 228-697-3862
Source: MLS United,MLS#: 4167875
Facts & features
Interior
Bedrooms & bathrooms
- Bedrooms: 3
- Bathrooms: 2
- Full bathrooms: 2
Heating
- Central
Cooling
- Central Air
Appliances
- Included: Dishwasher, Refrigerator
Features
- Has fireplace: Yes
- Fireplace features: Living Room, Wood Burning
Interior area
- Total structure area: 1,744
- Total interior livable area: 1,744 sqft
Video & virtual tour
Property
Parking
- Parking features: Driveway
- Has uncovered spaces: Yes
Features
- Levels: One
- Stories: 1
- Exterior features: Rain Gutters
- Fencing: Back Yard
Lot
- Size: 0.25 Acres
Details
- Additional structures: Shed(s)
- Parcel number: 05402339.000
Construction
Type & style
- Home type: SingleFamily
- Property subtype: Residential, Single Family Residence
Materials
- Brick
- Foundation: Slab
- Roof: Architectural Shingles
Condition
- Move In Ready
- New construction: No
- Year built: 1993
Utilities & green energy
- Sewer: Public Sewer
- Water: Public
- Utilities for property: Electricity Connected, Water Connected
Community & HOA
Community
- Subdivision: Gulf Park Estates
HOA
- Has HOA: No
Location
- Region: Ocean Springs
Financial & listing details
- Price per square foot: $149/sqft
- Tax assessed value: $94,539
- Annual tax amount: $946
- Date on market: 11/9/2026
- Electric utility on property: Yes
Estimated market value
$255,100
$242,000 - $268,000
$1,802/mo
Price history
| Date | Event | Price |
|---|---|---|
| 11/9/2026 | Listed for sale | $259,000+12.7%$149/sqft |
Source: MLS United #4167875 Report a problem | ||
| 3/25/2024 | Sold | -- |
Source: MLS United #4070561 Report a problem | ||
| 2/19/2024 | Pending sale | $229,900$132/sqft |
Source: MLS United #4070561 Report a problem | ||
| 2/12/2024 | Listed for sale | $229,900+62%$132/sqft |
Source: MLS United #4070561 Report a problem | ||
| 10/11/2019 | Sold | -- |
Source: MLS United #18308001_3349202 Report a problem | ||
| 7/29/2019 | Price change | $141,900-3.5%$81/sqft |
Source: RE/MAX Real Estate Partners #349202 Report a problem | ||
| 6/5/2019 | Listed for sale | $147,000$84/sqft |
Source: RE/MAX Real Estate Partners #349202 Report a problem | ||
Public tax history
| Year | Property taxes | Tax assessment |
|---|---|---|
| 2025 | $946 -45.5% | $9,454 -62.1% |
| 2024 | $1,735 +99.5% | $24,972 +50% |
| 2023 | $870 +1.7% | $16,648 |
| 2022 | $856 -0.8% | $16,648 -0.7% |
| 2021 | $863 +9.6% | $16,766 +103.8% |
| 2020 | $787 +7.3% | $8,226 +3.4% |
| 2018 | $734 | $7,957 -10.1% |
| 2017 | $734 -13.6% | $8,850 |
| 2016 | $850 | $8,850 -89% |
| 2015 | $850 +10.4% | $80,460 +869.7% |
| 2014 | $770 +8.1% | $8,297 +6.3% |
| 2013 | $712 +0.2% | $7,806 +0% |
| 2012 | $711 -1.7% | $7,805 -1.2% |
| 2011 | $723 -5.5% | $7,903 -3.9% |
| 2010 | $764 -19.4% | $8,225 -18.3% |
| 2009 | $948 +2.9% | $10,067 -2.5% |
| 2008 | $921 +37.3% | $10,325 +31.5% |
| 2007 | $671 -0.2% | $7,850 +0.5% |
| 2006 | $672 | $7,812 |
| 2005 | $672 -0.6% | $7,812 |
| 2004 | $676 -0.1% | $7,812 |
| 2003 | $677 -0.1% | $7,812 |
| 2002 | $678 -14.6% | $7,812 +7.9% |
| 2001 | $794 -3.2% | $7,237 |
| 2000 | $820 | $7,237 |
Find assessor info on the county website
Monthly payment
Est. payment
Payment breakdown
Explore the cost of this home by adjusting the details. Changes won't be saved.Climate risks
Neighborhood: Gulf Park Estates

Similar homes
- $265,0003 bd2 ba1.7k sqft3424 N 9th St, Ocean Springs, MS 39564For Sale
 MLS ID #4158675, Jordan Brown, NextHome Simplicity (BOF). MLS United
- $275,0004 bd2 ba1.9k sqft3417 N 11th St, Ocean Springs, MS 39564For Sale
 MLS ID #4159202, Ally Rayne, Century 21 Busch Realty Group. MLS United
- $289,0004 bd2 ba1.6k sqft109 Booth Cir, Ocean Springs, MS 39564For Sale
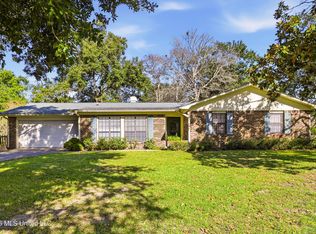 MLS ID #4166131, Charlie F Green, Charlie Green Real Estate. MLS United
- $268,0003 bd2 ba1.6k sqft1622 Lori Dr, Ocean Springs, MS 39564For Sale
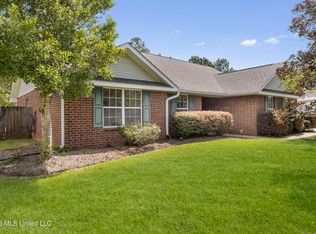 MLS ID #4164158, Tracey Ross, Rain Residential. MLS United
