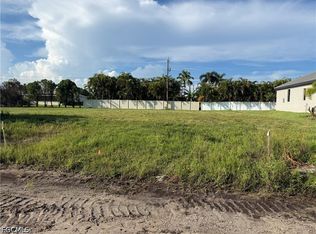
Excellent opportunity to build your dream home or investment property in desirable SW Cape Coral! This residential homesite offers approximately 0.23 acres with an 80' x 125' lot configuration and desirable north-facing rear exposure. Located in an established and growing neighborhood with convenient access to shopping, dining, schools, parks, and major roadways. City water, sewer, and irrigation are available in the area; buyer to verify utility connection status, assessments, and balances with the City of Cape Coral. No HOA. Bring your builder and take advantage of this Southwest Cape Coral location!
Active
$115,000
3223 SW 7th Ln, Cape Coral, FL 33991
--beds
--baths
10,018Square Feet
Unimproved Land
Built in ----
10,018 Square Feet Lot
$-- Zestimate®
$--/sqft
$-- HOA
What's special
Desirable north-facing rear exposure
- 40 days
- 41
- 0
Zillow last checked:
Listing updated:
Listed by:
Binh Duong 239-977-8899,
Premiere Plus Realty Company
Source: Florida Gulf Coast MLS,MLS#: 2026038525 Originating MLS: Florida Gulf Coast
Facts & features
Interior
Video & virtual tour
Property
Features
- Has view: Yes
- View description: Landscaped
- Waterfront features: None
Lot
- Size: 10,018 Square Feet
- Dimensions: 80 x 125 x 80 x 125
- Features: Rectangular Lot
Details
- Parcel number: 184423C305333.0400
- Lease amount: $0
- Zoning description: R1-D
Utilities & green energy
- Sewer: Assessment Paid
- Water: Assessment Paid
- Utilities for property: None
Community & HOA
Community
- Features: Non-Gated
- Condo and coop fee: $0
- Membership fee: $0
- Subdivision: CAPE CORAL
HOA
- Services included: None
Location
- Region: Cape Coral
Financial & listing details
- Tax assessed value: $80,750
- Annual tax amount: $2,532
- Date on market: 9/15/2026
- Listing terms: All Financing Considered,Cash,Contract,FHA,VA Loan
Estimated market value
Not available
Estimated sales range
Not available
Not available
Price history
| Date | Event | Price |
|---|---|---|
| 9/15/2026 | Listed for sale | $115,000 |
Source:  Florida Gulf Coast MLS #2026038525 Report a problem | ||
| 8/14/2026 | Listing removed | $115,000 |
Source: Florida Gulf Coast MLS #2025005775 Report a problem | ||
| 8/16/2025 | Listed for sale | $115,000+4.5% |
Source: Florida Gulf Coast MLS #2025005775 Report a problem | ||
| 1/11/2024 | Listing removed | -- |
Source:  Florida Gulf Coast MLS #223002680 Report a problem | ||
| 1/11/2023 | Listed for sale | $110,000+7.8% |
Source: Florida Gulf Coast MLS #223002680 Report a problem | ||
| 5/11/2022 | Sold | $102,000-7.2% |
Source: Florida Gulf Coast MLS #222025316 Report a problem | ||
| 4/14/2022 | Pending sale | $109,900 |
Source: Florida Gulf Coast MLS #222025316 Report a problem | ||
| 4/4/2022 | Listed for sale | $109,900-12.7% |
Source: Florida Gulf Coast MLS #222025316 Report a problem | ||
| 2/24/2022 | Listing removed | -- |
Source: Owner Report a problem | ||
| 2/24/2022 | Price change | $125,900+27.5% |
Source: Owner Report a problem | ||
| 2/18/2022 | Listed for sale | $98,750 |
Source: Owner Report a problem | ||
Public tax history
| Year | Property taxes | Tax assessment |
|---|---|---|
| 2025 | $2,533 +8% | $73,098 +10% |
| 2024 | $2,345 -34% | $66,453 +10% |
| 2023 | $3,552 +16.5% | $60,412 +301.6% |
| 2022 | $3,049 +6% | $15,044 +10% |
| 2021 | $2,877 -5.6% | $13,676 +10% |
| 2020 | $3,049 -0.1% | $12,433 -40.8% |
| 2019 | $3,050 | $21,000 |
| 2018 | $3,050 +0.4% | $21,000 +37.6% |
| 2017 | $3,039 +519.6% | $15,262 +9% |
| 2016 | $490 +8% | $14,000 +27.3% |
| 2015 | $454 +12.5% | $11,000 +10.4% |
| 2014 | $403 +19% | $9,964 +42.3% |
| 2013 | $339 +47.2% | $7,000 +20.7% |
| 2012 | $230 -3.5% | $5,800 -7.9% |
| 2011 | $239 -21.8% | $6,300 -30% |
| 2010 | $305 -30.5% | $9,000 -43% |
| 2009 | $439 +16.7% | $15,800 -12.2% |
| 2008 | $376 -70.6% | $18,000 -74.3% |
| 2007 | $1,281 -31.7% | $70,000 -30.5% |
| 2006 | $1,875 +275.9% | $100,700 +366.2% |
| 2004 | $499 +81.1% | $21,600 +99.6% |
| 2003 | $275 +83.5% | $10,820 +109.3% |
| 2002 | $150 | $5,170 |
| 2000 | -- | $5,170 |
Find assessor info on the county website
Monthly payment
Climate risks
Neighborhood: 33991


Similar homes
- $115,00010,497 sqft3408 Ceitus Pkwy, Cape Coral, FL 33991Lot/Land
 MLS ID #2026029669, Christopher DeRupo, Re/Max Sunshine. Florida Gulf Coast MLS
- $115,00010,018 sqftCape Coral, Cape Coral, FL 33991Lot/Land

 MLS ID #A12083885, Monica Briceno, United Real Estate Miami. MIAMI
- $135,0000.26 acresCape Coral, Cape Coral, FL 33991Lot/Land
 MLS ID #A12063944, Roger Schaeffler, Florida Realty of Miami Corp. MIAMI
- $149,00010,497 sqft142 SW 36th Pl, Cape Coral, FL 33991Lot/Land
 MLS ID #2026044042, Jeffrey Simpson, Tudor Villas Realty Corp. Florida Gulf Coast MLS
- $100,0000.26 acres3626 SW 3rd St, Cape Coral, FL 33991Lot/LandMLS ID #2026042097, Carolina Tiuso, Tiuso Realty Group. Florida Gulf Coast MLS
- $135,00010,018 sqft403 SW 26th Pl, Cape Coral, FL 33991Lot/LandMLS ID #2026042222, Andres Guarin, Universe Realty Group, Inc. Florida Gulf Coast MLS
- $90,00010,018 sqft3613 SW 3rd St, Cape Coral, FL 33991Lot/LandMLS ID #2026042126, Carolina Tiuso, Tiuso Realty Group. Florida Gulf Coast MLS
- $118,00010,018 sqft3318 SW 8th St, Cape Coral, FL 33991Lot/LandMLS ID #224062737, Stephanie Doran, EXIT Gulf Coast Realty. Florida Gulf Coast MLS
- $113,0007,004 sqft11971 Scallop Dr, Cape Coral, FL 33991Lot/LandMLS ID #224021743, Brian Barnhart, Gulf Gateway Realty, Inc.. Florida Gulf Coast MLS
- $69,80010,018 sqftCape Coral, Cape Coral, FL 33991Lot/LandMLS ID #A11993243, Joan Pereira, Florida Realty of Miami Corp. MIAMI
- $95,0000.36 acres329 SW 24th Pl, Cape Coral, FL 33991Lot/LandMLS ID #2026042138, Carolina Tiuso, Tiuso Realty Group. Florida Gulf Coast MLS
- $100,0000.34 acres2825 SW 1st Ter, Cape Coral, FL 33991Lot/LandMLS ID #2026037169, Cathy Adkins, Florida Resale Properties Inc. Florida Gulf Coast MLS
- $117,50010,018 sqft3618 SW 3rd St, Cape Coral, FL 33991Lot/LandMLS ID #2026012480, Lisbet Fundora Pereira, First Step Realty Group. Florida Gulf Coast MLS
- $95,00010,410 sqft2122 SW 4th ST, CAPE CORAL, FL 33991Lot/Land
 MLS ID #226032466, Yitzy Laza, O K Realty Inc. SWFLMLS
- $95,00010,410 sqft2118 SW 4th ST, CAPE CORAL, FL 33991Lot/LandMLS ID #226033170, Yitzy Laza, O K Realty Inc. SWFLMLS
- $95,00010,410 sqft2114 SW 4th ST, CAPE CORAL, FL 33991Lot/LandMLS ID #226032462, Yitzy Laza, O K Realty Inc. SWFLMLS
- $98,90010,018 sqft345 SW 29th Ave, Cape Coral, FL 33991Lot/LandMLS ID #2026024787, Andrew McLaughlin, Vista Key Real Estate, LLC. Florida Gulf Coast MLS
- $105,00010,018 sqft118 SW 37th Ave, Cape Coral, FL 33991Lot/LandMLS ID #2026029673, Christopher DeRupo, Re/Max Sunshine. Florida Gulf Coast MLS
