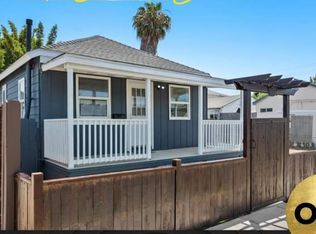
Discover a versatile multi-unit property at 327–329 28th Street in San Diego. Set on an approximately 5,001 sq. ft. lot, the property offers approximately 1,841 sq. ft. of total living area, with two separate units: a three-bedroom, three-bathroom home with a dedicated office, currently vacant, and a rented two-bedroom, one-bathroom unit. Both units feature split-unit air conditioning. Enjoy a backyard and parking for two cars, with downtown San Diego nearby. The property also offers potential for an ADU conditional on zoning & city permits, creating an opportunity to explore additional value. A flexible option for an owner-occupant or investor seeking a property with existing rental income and room to explore future possibilities.
For sale
Price cut: $50K (11/12)
$1,140,000
327-29 28th St, San Diego, CA 92102
5beds
--sqft
Multi Family
Built in 1930
-- sqft lot
$1,134,900 Zestimate®
$--/sqft
$-- HOA
What's special
Parking for two carsDedicated officeThree-bedroom three-bathroom homeTwo-bedroom one-bathroom unitSplit-unit air conditioning
- 16 days
- 362
- 29
Zillow last checked:
Listing updated:
Listed by:
Seror M Al Jubori DRE #02199685 225-247-1770,
SDpremier
Source: SDMLS,MLS#: 260025930 Originating MLS: SDMLS
Facts & features
Interior
Bedrooms & bathrooms
- Bedrooms: 5
- Bathrooms: 4
- Full bathrooms: 4
Cooling
- Zoned Area(s)
Interior area
- Total structure area: 0
Video & virtual tour
Property
Features
- Levels: 1 Story
- Fencing: Partial
Lot
- Size: 5,227 Square Feet
Details
- Parcel number: 5451611000
- Zoning: R-4:MULTIP
- Zoning description: R-4:MULTIP
Construction
Type & style
- Home type: MultiFamily
- Property subtype: Multi Family
Materials
- Wood
- Roof: Composition
Condition
- Year built: 1930
Community & HOA
Community
- Security: N/K
- Subdivision: South Park (304)
Location
- Region: San Diego
Financial & listing details
- Tax assessed value: $887,000
- Date on market: 10/29/2026
- Listing terms: Cash,Conventional,FHA,VA
- Tenant pays: N/K
Estimated market value
$1,134,900
$1.08M - $1.19M
$3,010/mo
Price history
| Date | Event | Price |
|---|---|---|
| 11/12/2026 | Price change | $1,140,000-4.2% |
Source:  SDMLS #260025930 Report a problem | ||
| 10/29/2026 | Listed for sale | $1,190,000+34.2% |
Source: SDMLS #260025930 Report a problem | ||
| 8/18/2025 | Sold | $887,000+34.4% |
Source: Public Record Report a problem | ||
| 7/31/2018 | Sold | $660,000+198.6% |
Source: Public Record Report a problem | ||
| 10/15/2010 | Sold | $221,000+16.3% |
Source: Public Record Report a problem | ||
| 7/17/2002 | Sold | $190,000 |
Source: Public Record Report a problem | ||
Public tax history
| Year | Property taxes | Tax assessment |
|---|---|---|
| 2026 | -- | $887,000 +20.5% |
| 2025 | $9,772 +9.8% | $736,237 +2% |
| 2024 | $8,900 +2.3% | $721,802 +2% |
| 2023 | $8,703 +2.7% | $707,650 +2% |
| 2022 | $8,472 +0.7% | $693,775 +2% |
| 2021 | $8,414 +1.2% | $680,172 +1% |
| 2020 | $8,312 +2.2% | $673,199 +2% |
| 2019 | $8,131 +175.1% | $660,000 +165.2% |
| 2018 | $2,956 +2.4% | $248,838 +2% |
| 2017 | $2,885 +1.7% | $243,959 +2% |
| 2016 | $2,839 +1.5% | $239,177 +1.5% |
| 2015 | $2,797 +1.6% | $235,585 +2% |
| 2014 | $2,754 | $230,971 +0.5% |
| 2013 | -- | $229,928 +2% |
| 2012 | -- | $225,420 +2% |
| 2011 | -- | $221,000 +5.9% |
| 2010 | -- | $208,689 -0.2% |
| 2009 | -- | $209,186 +2% |
| 2008 | -- | $205,085 +2% |
| 2007 | -- | $201,065 +2% |
| 2006 | -- | $197,123 +2% |
| 2005 | -- | $193,259 -42.3% |
| 2004 | -- | $335,000 +80.1% |
| 2003 | -- | $186,000 +302.4% |
| 2002 | -- | $46,226 +2% |
| 2001 | -- | $45,320 |
Find assessor info on the county website
Monthly payment
Est. payment
Payment breakdown
Explore the cost of this home by adjusting the details. Changes won't be saved.Climate risks
Neighborhood: Grant Hill



Similar homes
- $1,300,0008 bd5 ba2.3k sqft1017-19 33rd St, San Diego, CA 92102For Sale
 MLS ID #PTP2607902, Angela Kim, AK Real Estate. CRMLS
- $1,299,0003 bd4 ba-- sqftSouth Park, San Diego, CA 92102For Sale
 MLS ID #260024419, Kevin Haggerty, Keller Williams La Jolla. SDMLS
- $1,050,0007 bd5 ba-- sqftN/A, San Diego, CA 92113For Sale
 MLS ID #260026969, Erick Salgado, Palisade Realty Inc. SDMLS
- $1,195,0006 bd4 ba-- sqftno, San Diego, CA 92113For Sale
 MLS ID #260020132, Cameron Ebrahimi, Bridgepoint Realty Inc. SDMLS
