PRICE REDUCED. Build your dream home in one of the fastest-growing areas of Lehigh Acres! This well-located vacant lot offers the perfect opportunity for homeowners, builders, or investors looking to secure property in a desirable and developing neighborhood. Situated in a good area with new construction nearby, this lot provides a great setting for a future residence with plenty of space to design exactly what you want.
Even better — THE ADJACENT LOT IS ALSO FOR SALE, creating a rare opportunity to own side-by-side parcels. Perfect for building a larger custom home, adding a detached garage or workshop, building two investment properties, or holding for future appreciation.
Conveniently located near schools, shopping, restaurants, and main roads, while still offering the privacy and space that Lehigh Acres is known for.
Pending
$25,000
3314 51st St W, Lehigh Acres, FL 33971
--beds
--baths
0.25Acres
Unimproved Land
Built in ----
0.25 Acres Lot
$-- Zestimate®
$--/sqft
$-- HOA
What's special
- 275 days
- 0
- 0
Zillow last checked:
Listing updated:
Listed by:
Marelis Veloz Medina 239-785-8847,
Realty One Group MVP
Source: Florida Gulf Coast MLS,MLS#: 2026006982 Originating MLS: Florida Gulf Coast
Facts & features
Property
Features
- Waterfront features: None
Lot
- Size: 0.25 Acres
- Dimensions: 80 x 137 x 80 x 137
- Features: Other
Details
- Parcel number: 114426L307065.0170
- Lease amount: $0
- Zoning description: RS-1
Utilities & green energy
- Sewer: None
- Water: None
- Utilities for property: None, Sewer Not Available, Water Not Available
Community & HOA
Community
- Features: None
- Condo and coop fee: $0
- Membership fee: $0
- Subdivision: SABAL PALM GARDENS
HOA
- Services included: None
Location
- Region: Lehigh Acres
Financial & listing details
- Tax assessed value: $16,150
- Annual tax amount: $454
- Date on market: 2/8/2026
- Cumulative days on market: 276 days
- Listing terms: Cash
- Road surface type: Paved
Estimated market value
Not available
Estimated sales range
Not available
Not available
Price history
| Date | Event | Price |
|---|---|---|
| 8/4/2026 | Pending sale | $25,000 |
Source:  Florida Gulf Coast MLS #2026006982 Report a problem | ||
| 4/13/2026 | Price change | $25,000-16.7% |
Source: Florida Gulf Coast MLS #2026006982 Report a problem | ||
| 2/9/2026 | Listed for sale | $30,000+33.3% |
Source: Florida Gulf Coast MLS #2026006982 Report a problem | ||
| 3/28/2025 | Sold | $22,500-27.4% |
Source:  SWFLMLS #225016228 Report a problem | ||
| 3/17/2025 | Pending sale | $31,000 |
Source: SWFLMLS #225016228 Report a problem | ||
| 2/13/2025 | Listed for sale | $31,000+6.9% |
Source: SWFLMLS #225016228 Report a problem | ||
| 8/15/2024 | Listing removed | -- |
Source: SWFLMLS #224043773 Report a problem | ||
| 5/16/2024 | Listed for sale | $29,000+20.8% |
Source: SWFLMLS #224043773 Report a problem | ||
| 4/4/2024 | Sold | $24,000 |
Source: Florida Gulf Coast MLS #224025013 Report a problem | ||
| 3/20/2024 | Pending sale | $24,000 |
Source: SWFLMLS #224025013 Report a problem | ||
| 3/18/2024 | Listed for sale | $24,000+27% |
Source: SWFLMLS #224025013 Report a problem | ||
| 7/20/2022 | Listing removed | -- |
Source:  Florida Gulf Coast MLS #222044208 Report a problem | ||
| 6/8/2022 | Listed for sale | $18,900 |
Source: Florida Gulf Coast MLS #222044208 Report a problem | ||
Public tax history
| Year | Property taxes | Tax assessment |
|---|---|---|
| 2025 | $455 +29.4% | $16,150 +244.7% |
| 2024 | $351 +11.1% | $4,685 +10% |
| 2023 | $316 +12.5% | $4,259 +10% |
| 2022 | $281 +10.4% | $3,872 +10% |
| 2021 | $255 +2.2% | $3,520 +10% |
| 2020 | $249 +125.1% | $3,200 -15.8% |
| 2019 | $111 | $3,800 -15.6% |
| 2018 | $111 +5.4% | $4,500 +46.6% |
| 2017 | $105 +14.5% | $3,069 -22.5% |
| 2016 | $92 -0.8% | $3,960 +55.3% |
| 2015 | $93 +13.8% | $2,550 +6% |
| 2014 | $81 +25.2% | $2,405 +26.6% |
| 2013 | $65 +4.2% | $1,900 -9.5% |
| 2012 | $62 -3.7% | $2,100 -4.5% |
| 2011 | $65 -10.7% | $2,200 -15.4% |
| 2010 | $72 -15.4% | $2,600 -25.7% |
| 2009 | $86 -48.2% | $3,500 -61.1% |
| 2008 | $165 -47.1% | $9,000 -50.4% |
| 2007 | $313 -48.7% | $18,150 -49.6% |
| 2006 | $609 +804% | $36,000 +1340% |
| 2004 | $67 +64.8% | $2,500 +163.2% |
| 2003 | $41 -1.9% | $950 |
| 2002 | $42 | $950 |
| 2000 | -- | $950 |
Find assessor info on the county website
Monthly payment
Est. payment
Payment breakdown
Explore the cost of this home by adjusting the details. Changes won't be saved.Climate risks
Neighborhood: 33971


Similar homes
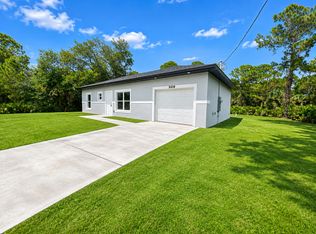
- $27,0000.25 acres3016 52nd ST W, LEHIGH ACRES, FL 33971Lot/Land
 MLS ID #226040915, Luis Osio, Oasis Intl Realty Group LLC. SWFLMLS
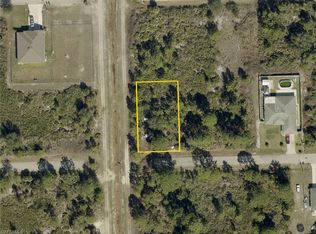
- $25,0000.25 acres3218 51st St W, Lehigh Acres, FL 33971Lot/Land
 MLS ID #2026034565, Jose Torna, RE/MAX Realty Team. Florida Gulf Coast MLS
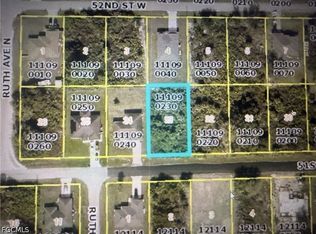
- $22,9000.25 acres3119 48th ST W, LEHIGH ACRES, FL 33971Lot/Land
 MLS ID #226040510, Yaneisy Martinez Pinero, Invest Ready Realty. SWFLMLS
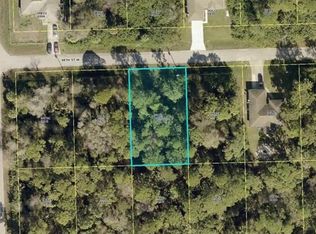
- $24,9000.25 acres3304 50th ST W, LEHIGH ACRES, FL 33971Lot/Land
 MLS ID #226018811, David A Irwin, EXP Realty LLC. SWFLMLS
- $26,9000.25 acresLehigh Acres, Lehigh Acres, FL 33971Lot/Land
 MLS ID #A12109114, Karina Sabadell, United Realty Group Inc.. MIAMI
- $24,9000.25 acres3106 50th St W, Lehigh Acres, FL 33971Lot/LandMLS ID #2026014905, Stephanie Fajardo, MGR Realty Services, Inc.. Florida Gulf Coast MLS
- $21,5000.25 acres3004 48th St W, Lehigh Acres, FL 33971Lot/LandMLS ID #2026046549, Louis Bonadies, Realty World-C Bagans 1st. Florida Gulf Coast MLS
- $25,0000.66 acres3223 47th St W, Lehigh Acres, FL 33971Lot/LandMLS ID #2026040266, Esperencia Cadet Romain, Coldwell Banker Preferred Properties. Florida Gulf Coast MLS
- $20,0000.25 acres3417 49th St W, Lehigh Acres, FL 33971Lot/LandMLS ID #2026044823, Nadine Russell, Coldwell Banker Preferred Properties. Florida Gulf Coast MLS
- $27,0000.25 acres3303 51st St W, Lehigh Acres, FL 33971Lot/LandMLS ID #2026033331, Jenny Guillen, EXP Realty LLC. Florida Gulf Coast MLS
- $22,0000.25 acres3116 49th ST W, LEHIGH ACRES, FL 33971Lot/LandMLS ID #226032403, Arianna Jorrin, Key & Legacy Realty LLC. SWFLMLS
- $21,5000.25 acres3301 53rd St W, Lehigh Acres, FL 33971Lot/LandMLS ID #2026030013, Troy Wesolek, iConnect RE. Florida Gulf Coast MLS
- $23,0000.25 acres3509 50th St W, Lehigh Acres, FL 33971Lot/LandMLS ID #225029043, Suzanne Johnson, Dalton Wade Inc. Florida Gulf Coast MLS
- $22,9000.34 acres5109 Vera AVE N, LEHIGH ACRES, FL 33971Lot/LandMLS ID #226031226, Jake Harcarik, Realty One Group MVP. SWFLMLS
- $28,9000.25 acres5900 SALLY AVENUE N LOT 1, LEHIGH ACRES, FL 33971Lot/Land
 MLS ID #TB8449554, Hernando Rueda, EXP REALTY LLC. Stellar MLS
- $28,5000.25 acresLehigh Acres, Lehigh Acres, FL 33971Lot/LandMLS ID #A11955677, Lydia Wyness, United Realty Group Inc.. MIAMI
- $20,0000.25 acresLehigh Acres, Lehigh Acres, FL 33971Lot/LandMLS ID #A12065724, Javier Santana, Sunland Real Estate, LLC.. MIAMI
- $20,2500.27 acres3612 50th St W, Lehigh Acres, FL 33971Lot/LandMLS ID #2026027325, Leo Martin, Realty World-C Bagans 1st. Florida Gulf Coast MLS
- $27,0000.25 acres3220 48th St W, Lehigh Acres, FL 33971Lot/LandMLS ID #2026034896, Jenny Guillen, EXP Realty LLC. Florida Gulf Coast MLS
